How to profit from rising wedge pattern – Day trading SP 500 [Video]
![How to profit from rising wedge pattern – Day trading SP 500 [Video]](https://editorial.fxstreet.com/images/Markets/Equities/SP500/wall_street_nyse2-637299021353183737.jpg)
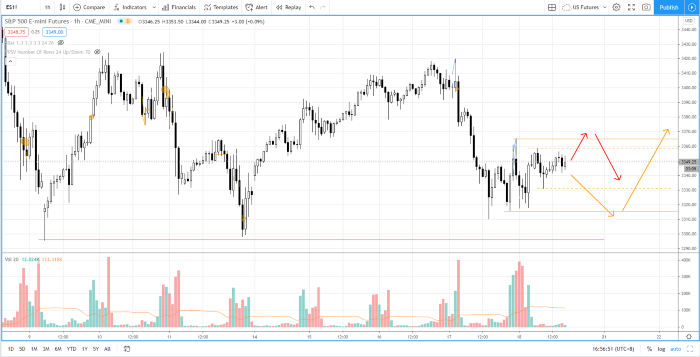
Check out the video for a complete walk through of the daily market analysis of S&P 500 futures (ES) for 18 Sep 2020 trading session. In this video, I am going to show you the market recap during the last session and a trade review for a possible trade in the three-minutes timeframe (including entry, exit and the rationale behind). I talked about how to trade the rising wedge pattern in yesterday video. So, today's video, I will elaborate the detail with trading the rising wedge pattern using the S&P 500 trade as a case study.
Bias — neutral (Day trading); bullish (long term)
Key levels — Resistance: 3360-3380, 3425, 3450; Support: 3300, 3230
Potential setup — Look for potential reversal at the key levels.
Author

Ming Jong Tey
Independent Analyst
Ming Jong Tey has been trading since 2008. He started his learning journey from technical analysis (indicators, Fibonacci, etc...) to value investing. Throughout his journey, he develops an interest in price action with chart pattern trading.


