How to anticipate turning points with the liquidity gap - SPX500 - EUR/USD - WTI [Video]

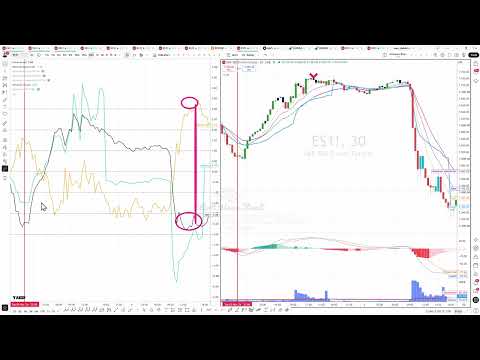
After the midterm elections, the ES went on a roller coaster. A sharp sell-off as the first results came in, a V-shaped bounce to 7,750, a collapse into the 7,300s, and a recovery to 7,557. Price action like that looks impossible to follow. The question in this video is whether you could have been ready for it. The answer is in the liquidity.
In short: every turn on the ES was preceded by a gap between price and liquidity. Today the Self is above 2 and the Big Guy is heading down, so we're getting ready to sell toward the 7,500 area and the VWAP. On EUR/USD, liquidity is selling while price climbs, setting up a rejection and a fill of the gap to the VWAP. On oil, momentum is too strong to fight: we want a fresh low and a rejection before looking for a retrace toward 88.
The ES turns, one by one
On our liquidity chart, the black line (the Self) represents price, and the orange line represents the Big Guy's liquidity. When the two move in opposite directions, a liquidity gap opens. And that gap tends to close — when the black line meets the orange line.
- Election day: the initial reaction was bearish, but the orange line was climbing while the black line moved down. A significant liquidity gap: get ready for the close. Price bounced hard.
- The second gap: at the top, the gap opened again in the other direction. Nobody knew how far price would fall. But from that area, the only thing to think about was the sell side.
- Thursday's sell-off: the collapse into the 7,300s opened a big gap on the other side — and price moved up to close it.
ES live: getting ready for the sell
We're in a liquidity gap again on the live market: the Self is above 2 and the Big Guy is heading down. On the 5-minute chart, though, the MACD is still strong, and we don't want to fight it. The plan is to wait for a fresh high, then the first candle to close below the previous candle's high, and trigger with good money management. The minimum target is the 7,500 area, where the VWAP sits. From there, it could be a retrace — or something more significant to the downside.
EUR/USD: sell side only
The euro has been climbing after its sharp sell-off, with the same kind of aggressive V-shaped reversal seen across markets after the elections. On the 30-minute chart, liquidity is selling while price is going up. On the 5-minute chart, the plan is to fill the gap between price and the VWAP. From this area, the only bias is the sell side.
Oil: wait for the fresh low
Oil has been coming down, which is good news for inflation — even if oil around $90 is still expensive. We're at an extreme, looking for the end of this first wave, but momentum is too strong to trade against. We want a fresh low, a rejection, and then a retrace back to at least the 88 area.
What the "2" really measures
The black line is measured in standard deviations. If price changes were normally distributed, a two-standard-deviation move would put price somewhere it only reaches about 5% of the time. Real markets have fatter tails than a normal distribution, and in an election week those extremes show up more often. But the logic holds: at 2, price is statistically stretched.
That doesn't mean price will turn there. It means it's worth watching. What turns that extreme into a signal is liquidity on the other side: stretched price while the Big Guy does the opposite means the crowd is pushing one way while the Market Maker supplies the liquidity.
Why you don't sell the extreme right away
A common mistake is selling the moment price touches 2. With strong momentum, price can stay at the extreme much longer than expected. That's why the video insists on waiting: for a fresh high, for the MACD to lose strength, and for a candle to close below the previous high. The extreme tells you where to get ready. The trigger tells you when to act.
Prepare for direction, not distance
As the video puts it, nobody knew Thursday's sell-off would run over 400 points. What liquidity did reveal was direction. That's the difference between forecasting and preparing: if your entry is well placed and your risk is defined, a small move gives you a small gain, and a move like Thursday's gives you a much larger one.
The core idea
Turning points aren't random. When price stretches one way and liquidity moves the other, the gap tends to close. Technical analysis alone struggles to find an edge in markets this volatile. With liquidity as context, technical analysis becomes what it should be: a timing tool.
That's what we practice every day in the Elliott Wave Street trading room.
Did you trade last week's turns, or stay on the sidelines? Leave it in the comments on the video.
Author

Juan Maldonado
Elliott Wave Street
Juan Maldonado has a University degree in Finance, and Foreign trade started his trading career in 2008. Since 2010 has been analyzing the markets using Elliott Wave with different strategies to spot high probability trades.