How the MACD reveals institutional accumulation in EUR/USD

EUR/USD is falling. The trend is bearish, sentiment is negative, and most traders are either selling or waiting for it to drop further. But beneath that decline, there's something price alone doesn't show: the institutions have already started buying. In this breakdown, I show you how the MACD reveals that institutional accumulation before price turns around.
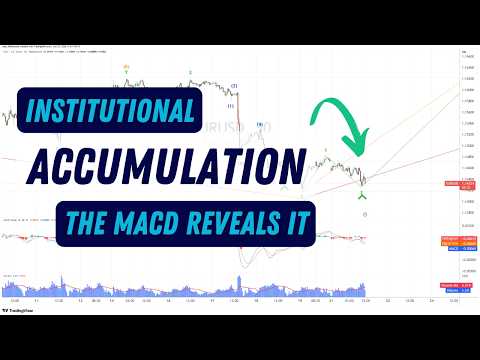
The first step: Are we in accumulation?
When a market is in a downtrend and you're looking for a buy, the first question isn't "where do I enter?" but "are the institutions accumulating?" Buying in a downtrend without that confirmation is catching a falling knife. With the confirmation, it's positioning yourself alongside institutional money before the turn.
The MACD is the tool that answers that question — but not the way most traders use it. It's not about waiting for the signal line cross. It's about reading the divergences — the moment when price and momentum stop moving together.
The divergences: The footprint of accumulation
Here's the central concept. When price makes a new low but the MACD doesn't make a correspondingly deeper low, that's a divergence. And a divergence in a downtrend means the selling momentum is exhausting, even though price keeps falling.
In the EUR/USD case, we don't see a single divergence — we see three in sequence. Price makes one, two, three new lows, but at each one the MACD shows less bearish strength. That repetition is the evidence. It's not random or noise: it's the pattern of institutions absorbing supply while the public keeps selling.
Each of those divergences represented a potential entry point. With proper risk management, the risk on each attempt stays controlled and small — because the entries sit right where the structure would invalidate the idea if we were wrong.
The clearest signal: The distance to the zero line
There's a detail of the MACD that few traders watch, and in this case, it's decisive.
When price enters the corrective Wave 2 and makes its bearish pullback, the distance between the MACD zero line and the low of the reading is minimal. Compare it to the earlier bearish moves, where the MACD plunged deep. Now it barely separates from the zero line.
That means supply is exhausting. The little selling pressure that remains no longer has the force to push the MACD far from its center. And the little supply that does come in is being absorbed by the institutional side. That compression of the MACD against the zero line is one of the cleanest signals that a bearish move is reaching its end.
The Elliott Wave count: Where we are in the cycle
The MACD divergences tell us there's accumulation. Elliott Wave tells us where we are in the cycle and what to expect.
After the accumulation points, price rises and forms the first wave — our candidate for Wave 1. Then comes the retracement, which is Wave 2 in development. It's precisely at the end of this Wave 2 where we find the highest-probability entry, because what follows is Wave 3 — typically the strongest and most extended wave of the impulse.
The combination is what creates the edge: the MACD confirms accumulation is happening, and Elliott Wave places us at the exact point in the cycle where that accumulation is about to turn into movement.
The targets and the alternative
From the end of Wave 2, the expected direction is bullish, with staggered targets: first the 1.4480 zone, then 1.4520, and later 1.4620. Each target can be tracked as price advances, adjusting position management at each level.
But a good plan always accounts for the alternative. What if supply increases and price makes one last liquidity grab? In that scenario, if price breaks the low and then rejects around 1.4420, that would be a new entry — the final move to take out the liquidity before starting the bullish cycle.
Having that alternative plan is what separates a complete trade idea from a simple directional hunch. We know what to do if the price rises from here, and we know what to do if it first drops to grab the liquidity.
The core idea
Identifying institutional accumulation isn't guessing. It's reading the MACD divergences, watching supply exhaustion against the zero line, placing the moment in the cycle with Elliott Wave, and entering where the risk is minimal and the potential is maximal. This lets us distinguish between the weak hands selling at the low and the strong hands accumulating — and position ourselves on the right side.
This is the kind of analysis we apply every day in our trading room, combining Elliott Wave, the MACD, and volume across multiple markets.
Author

Juan Maldonado
Elliott Wave Street
Juan Maldonado has a University degree in Finance, and Foreign trade started his trading career in 2008. Since 2010 has been analyzing the markets using Elliott Wave with different strategies to spot high probability trades.