Here’s where the EUR/USD and USD/JPY could be headed

the iran war, rising oil prices, inflation fears and geopolitical uncertainty are helping the u.s. dollar maintain its strength, as it is seen as a haven. interest rates are expected to remain unchanged despite an uptick in inflation data, as the federal reserve is expected to continue delaying rate cuts. the u.s. senate has confirmed kevin warsh in a tight 54 to 45 vote to be the new federal reserve chairman to replace jerome powell, as his term expires on may 15, 2026. warsh has widely been viewed as a hawk but has aligned himself with u.s. president donald trump’s stance on lowering interest rates. this adds further uncertainty to his future rate policy stance once he takes the reins of the fomc.
the eur/usd range compression could spark a break
higher energy prices, stoked by the iran war, have caused the european central bank (ecb) to revise its headline inflation projection to average 2.6%. the u.s. federal reserve is expected to delay rate cuts to december 2026 or even march 2027.
eur/usd broke out above the 50-week moving average on april 6, 2026, and the level remains a vital support at 1.16716. while the bollinger bands (bbs) initially expanded on the breakout, they have remained flat, with the upper bbs at 1.20190. this level can be viewed as a potential upside target if the stochastic rises through the 80-band level.
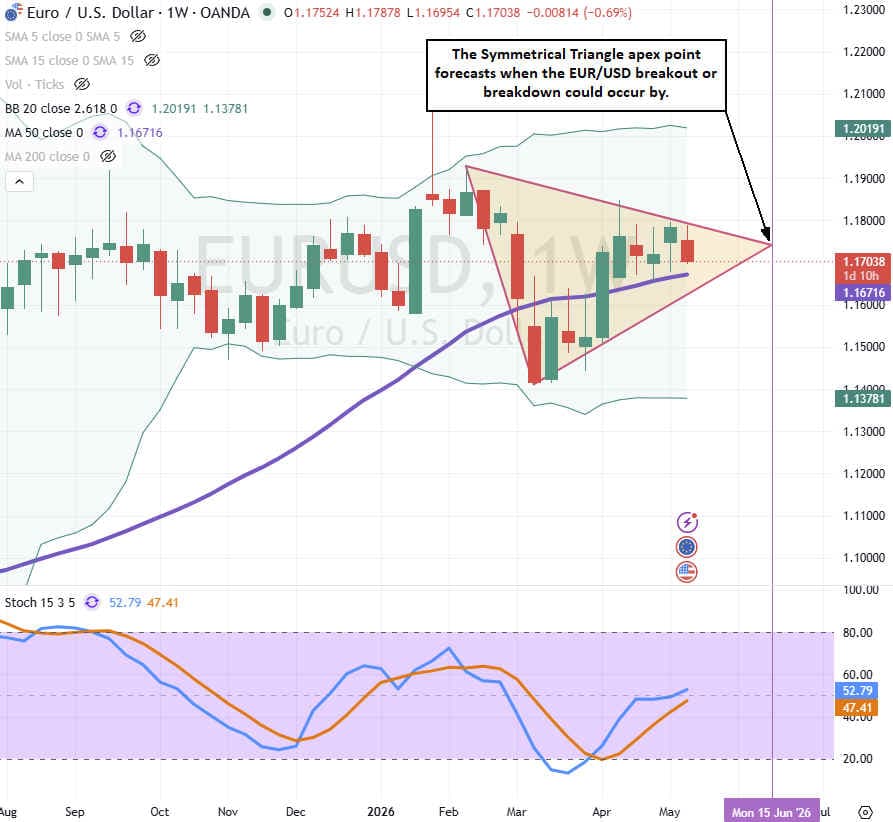
the eur/usd may be forming a weekly symmetrical triangle, characterized by lower highs and higher lows. symmetrical triangles indicate a price range compression that builds up steam and eventually results in a breakout above its upper descending trendline resistance or a breakdown under its ascending trendline support. while it doesn’t predict the direction, the apex point where the upper and lower trendlines converge is generally seen as a timing indicator for when the break should occur, which could be by june 15, 2026.
usd/jpy is attempting to reverse the weekly msh sell trigger
the bank of japan (boj) maintained its 0.75% interest rate at its april meeting. however, there is growing sentiment that it will raise rates as early as its next meeting in mid-june. this is fueled by rising oil prices stemming from the iran war and fears that it will accelerate japan’s underlying inflation.
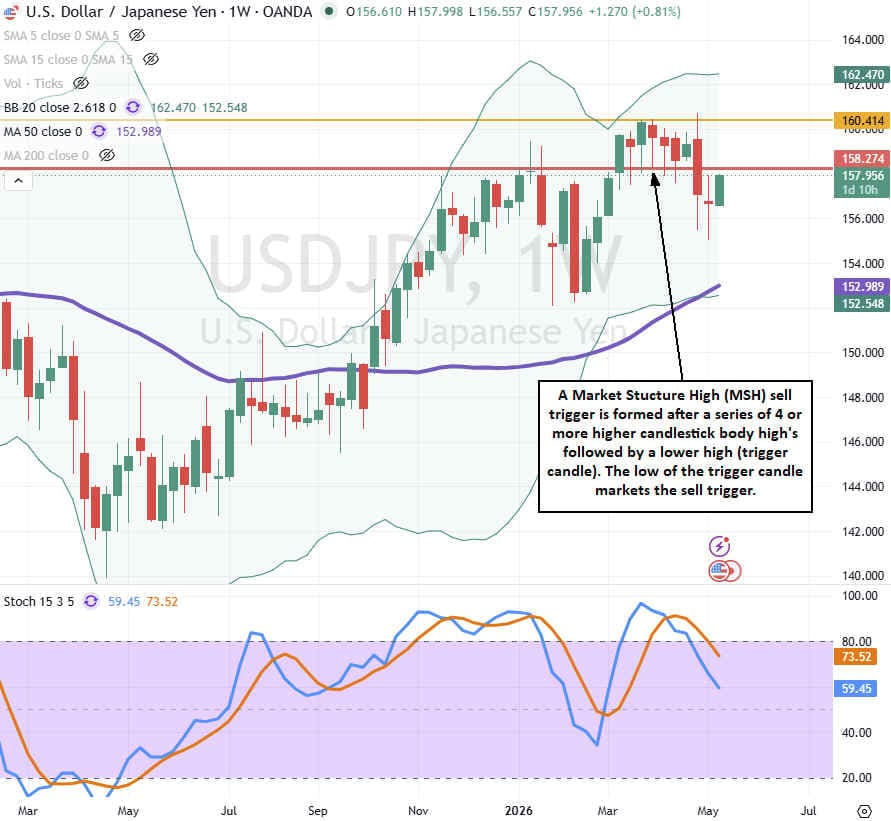
usd/jpy triggered a weekly market structure high (msh)sell trigger upon the breakdown below the 158.274 level on april 27, 2026. the stochastic fell under the overbought 80-band. however, the recent bounce off the low of 155.032 on may 4, 2026, created a doji candlestick, indicating an attempt to reverse the downtrend. an opposing market structure low (msl) trigger will form at the weekly candle close on may 15, 2026. this will create a showdown between the dueling msh and msl triggers to determine whether the usd/jpy will continue its descent towards its 50-week sma or reverse back up towards its msh at 160.414.
Author

Sigmanomics
Sigmanomics
Sigmanomics is a financial intelligence platform that delivers expert insights, data-driven analysis, and real-time trading signals across global markets.