Happy Halloween

USD: Dec '25 is Up at 99.355.
Energies: Dec '25 Crude is Down at 60.32.
Financials: The Dec '25 30 Year T-Bond is Lower by 8 ticks and trading at 117.11.
Indices: The Dec '25 S&P 500 emini ES contract is 212 ticks Higher and trading at 6909.50.
Gold: The Dec'25 Gold contract is trading Up at 4018.50.
Initial conclusion
This is not a correlated market. The USD is Up and Crude is Down which is normal, but the 30 Year T-Bond is trading Lower. The Financials should always correlate with the US dollar such that if the dollar is Higher, then the bonds should follow and vice-versa. The S&P is Lower and Crude is trading Lower which is not correlated. Gold is trading Higher which is not correlated with the US dollar trading Up. I tend to believe that Gold has an inverse relationship with the US Dollar as when the US Dollar is down, Gold tends to rise in value and vice-versa. Think of it as a seesaw, when one is up the other should be down. I point this out to you to make you aware that when we don't have a correlated market, it means something is wrong. As traders you need to be aware of this and proceed with your eyes wide open. All of Asia traded Lower except the Nikkei exchange. Currently all of Europe is trading Lower except the Milan exchange.
Possible challenges to traders
- FOMC Member Logan Speaks at 9:30 AM EST. Major.
- Chicago PMI is out at 9:45 AM EST. Major.
- FOMC Member Bostic Speaks at 12 noon EST. Major.
- FOMC Member Hammack Speaks at 12 noon EST. Major.
Traders, please note that we've changed the Bond instrument from the 10 Year (ZN) to the 2 Year (ZT). They work exactly the same.
We've elected to switch gears a bit and show correlation between the 2-year Treasury notes (ZT) and the S&P futures contract. The YM contract is the Dow Jones Industrial Average, and the purpose is to show reverse correlation between the two instruments. Remember it's likened to a seesaw, when up goes up the other should go down and vice versa.
Yesterday the ZT climbed Higher at around 8:30 AM EST with no economic news reported. The Dow dived Lower at the same time. Look at the charts below and you'll see a pattern for both assets. The ZT climbed Higher at around 8:30 AM EST and the Dow dived Lower at around the same time. These charts represent the newest version of Bar Charts, and I've changed the timeframe to a 15-minute chart to display better. This represented a Short opportunity on the 2-year note, as a trader you could have netted about 20 plus ticks per contract on this trade. Each tick is worth $6.25. Please note: the front month for ZT is now Dec '25 and the Dow is now Dec '25. I've changed the format to filled Candlesticks (not hollow) such that it may be more apparent and visible.
Charts courtesy of barcharts
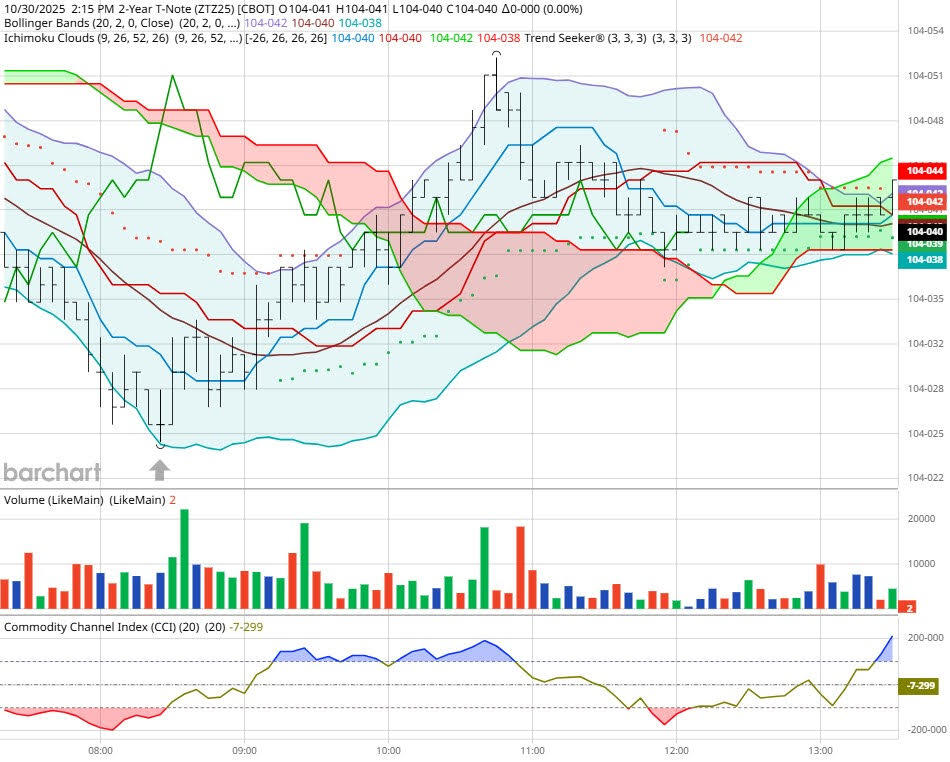
ZT -Dec 25 - 10/30/25
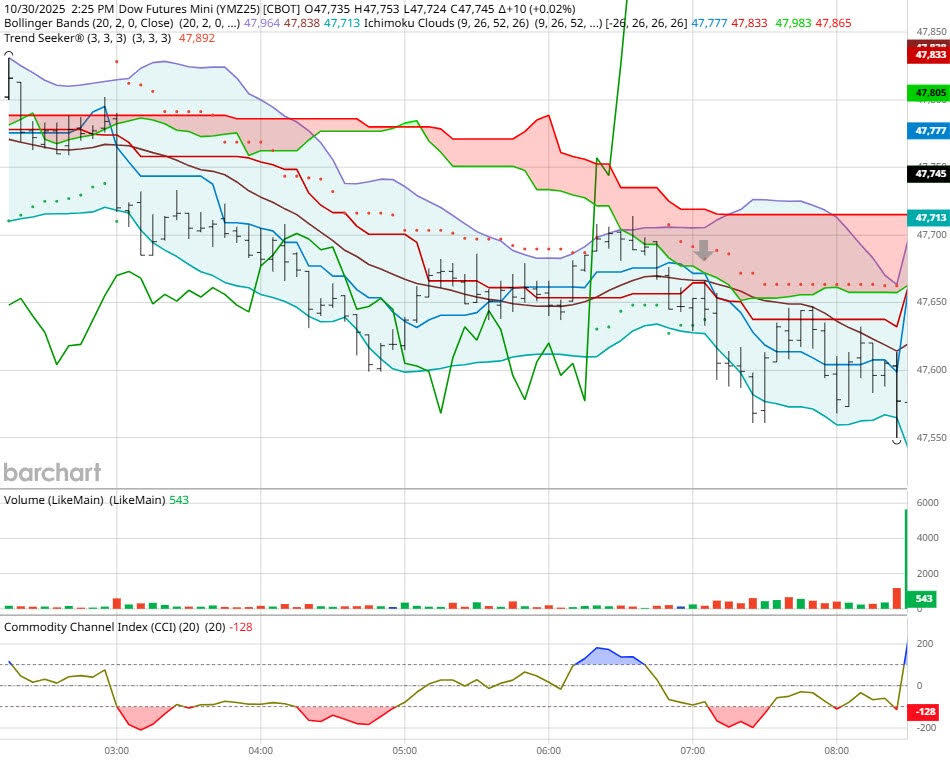
Dow - Dec 2025- 10/30/25
Bias
Yesterday we gave the markets an Upside bias but the markets had other ideas. The Dow dropped about 74 points, and the S&P closed Lower as well. The Nasdaq did gain ground. Today we aren't dealing with a correlated market, and our bias is to the Upside.
Could this change? Of Course. Remember anything can happen in a volatile market.
Commentary
So yesterday the markets traded Mixed or Neutral with the Nasdaq showing gain but the other indices not so much. Today we don't have much in the way of eco news but it is Halloween so anything can happen.
Author

Nick Mastrandrea
Market Tea Leaves
Nick Mastrandrea over 20 years experience in trading and formerly held a NASD Series 7. He currently holds a NJ Life, Health and Variable Authority. Nick is a published writer and his work has appeared in Futures Magazine, TraderPlanet and others.