Gold Weekly Forecast: Buyers second-guess bullish potential ahead of key US data
- Gold staged a rebound following a two-week drop.
- Middle East headlines and US inflation data could ramp up Gold volatility.
- The near-term technical outlook points to a lack of bullish momentum.

Gold (XAU/USD) reversed its direction after a bearish start to the week and climbed above $4,700. Still, the persistent uncertainty surrounding the Middle East crisis limited the yellow metal’s upside. Geopolitics and the upcoming inflation data from the United States (US) could drive Gold’s performance in the near term.
Gold rises as markets grow optimistic about a US-Iran truce
Gold came under renewed bearish pressure on Monday and lost nearly 2% on the day as weekend news pointed to a reescalation of tensions in the Strait of Hormuz. US President Donald Trump announced that they launched “Project Freedom” to guide neutral ships through the Strait. Iran's military responded and said that they will attack US forces if they attempt to enter or approach the region, adding that such action would be regarded as a violation of the ceasefire. Moreover, Iran reportedly attacked US warships attempting to pass through the Strait on Monday.
Improving risk mood and another suspected foreign exchange market intervention by Japan triggered a USD sell-off, helping XAU/USD stage a strong rebound following Monday’s sharp decline. US President Trump said they have paused Project Freedom, citing "great progress" toward a permanent peace agreement with Iran on Tuesday. On Wednesday, several news outlets reported that the US and Iran were closing in on a final agreement to end the conflict, providing a boost to market sentiment and paving the day for an extended Gold rally.
After rising nearly 3% on Wednesday, Gold continued to push higher during the Asian trading hours on Thursday and touched a new two-week top above $4,760. Later in the day, XAU/USD lost its traction and erased its gains to close the day flat as news of the US and Iranian military forces exchanging attacks in the Strait of Hormuz caused markets to turn cautious.
Nonetheless, Trump confirmed that the ceasefire was still in place and Gold managed to find a foothold and stabilize above $4,700 on Friday, with investors awaiting an official response from Tehran to the US’ revised proposal.
In the meantime, the US Bureau of Labor Statistics reported on Friday that Nonfarm Payrolls rose by 155K in April, surpassing the market expectation of 62K by a wide margin, while the Unemployment Rate held steady at 4.3%, as anticipated. The USD struggled to benefit from the upbeat employment data and allowed XAU/USD to remain in the upper half of its weekly range.
Gold traders await US inflation data, stay focused on Middle East
The US economic calendar will feature consumer and producer inflation data for April.
The Consumer Price Index (CPI) is forecast to rise by 0.6% on a monthly basis in April following the 0.9% increase recorded in March. The core CPI, which excludes volatile food and energy prices, is seen increasing by 0.4% in this period. A stronger-than-forecast print in the monthly core CPI could point to a spillover from energy inflation to consumer inflation.
In this scenario, the US Dollar (USD) could gather strength with the immediate reaction and cause XAU/USD to turn south on Tuesday. Conversely, a soft core CPI print could have the opposite effect.
Even if Gold benefits initially from a soft core inflation print, a steady bullish action could be difficult to come by while the US-Iran conflict persists. On the other hand, XAU/USD could gather bullish momentum and kick-start a decisive rally in case Oil prices decline sharply ifthe Strait of Hormuz opens up fully.
Johan Palmberg, a Senior Quantitative Analyst at the World Gold Council, explains that Gold struggled as the Middle East crisis unfolded due to “prior strong performance, broad deleveraging, a rate shock and liquidity needs.”
“The crisis remains unresolved, but markets – led by the US - have become sanguine. The US remains relatively sheltered from the energy shock and its consumers appear resilient enough for now,” Palmberg adds and says there is a “tug-of-war between short-term pressure and longer-term structural support.”
Gold technical analysis is yet to highlight a buildup in bullish momentum
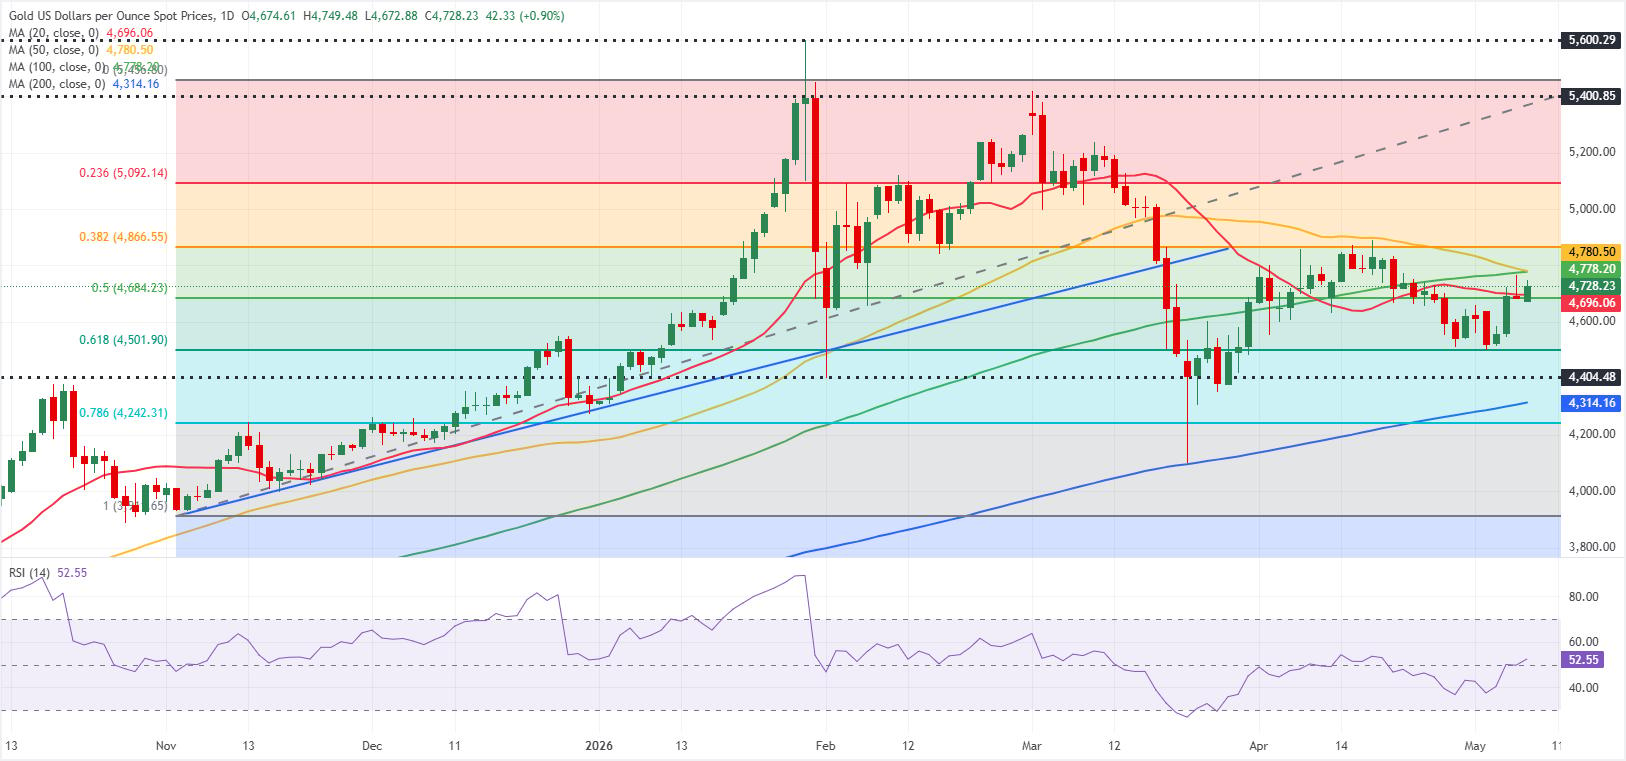
The Relative Strength Index (RSI) indicator on the daily chart moves sideways just a tad above the neutral line of 50 and Gold remains below the 100-day and the 50-day Simple Moving Averages (SMA), reflecting buyers’ hesitancy.
On the upside, $4,780 (50-day SMA, 100-day SMA) aligns as the first resistance level ahead of $4,866 (Fibonacci 38.2% retracement of the November - February uptrend) and $5,000 (psychological level). Looking south, support levels can be spotted at $4,684 (Fibonacci 50% retracement), $4,502 (Fibonacci 61.8% retracement) and $4,314 (200-day SMA).
Gold FAQs
Gold has played a key role in human’s history as it has been widely used as a store of value and medium of exchange. Currently, apart from its shine and usage for jewelry, the precious metal is widely seen as a safe-haven asset, meaning that it is considered a good investment during turbulent times. Gold is also widely seen as a hedge against inflation and against depreciating currencies as it doesn’t rely on any specific issuer or government.
Central banks are the biggest Gold holders. In their aim to support their currencies in turbulent times, central banks tend to diversify their reserves and buy Gold to improve the perceived strength of the economy and the currency. High Gold reserves can be a source of trust for a country’s solvency. Central banks added 1,136 tonnes of Gold worth around $70 billion to their reserves in 2022, according to data from the World Gold Council. This is the highest yearly purchase since records began. Central banks from emerging economies such as China, India and Turkey are quickly increasing their Gold reserves.
Gold has an inverse correlation with the US Dollar and US Treasuries, which are both major reserve and safe-haven assets. When the Dollar depreciates, Gold tends to rise, enabling investors and central banks to diversify their assets in turbulent times. Gold is also inversely correlated with risk assets. A rally in the stock market tends to weaken Gold price, while sell-offs in riskier markets tend to favor the precious metal.
The price can move due to a wide range of factors. Geopolitical instability or fears of a deep recession can quickly make Gold price escalate due to its safe-haven status. As a yield-less asset, Gold tends to rise with lower interest rates, while higher cost of money usually weighs down on the yellow metal. Still, most moves depend on how the US Dollar (USD) behaves as the asset is priced in dollars (XAU/USD). A strong Dollar tends to keep the price of Gold controlled, whereas a weaker Dollar is likely to push Gold prices up.
Author

Eren Sengezer
FXStreet
As an economist at heart, Eren Sengezer specializes in the assessment of the short-term and long-term impacts of macroeconomic data, central bank policies and political developments on financial assets.