Gold against USD: A breakout or another false start?

Friday, the thirteenth. Will gold have bad luck? Will the U.S. dollar?
Of course, the fact that it’s Friday the thirteenth has no impact on neither gold, nor the USD Index, but this day might be important for both markets due to other reasons.
And yes, Paraskevidekatriaphobia also known as friggatriskaidekaphobia (was another term for this really necessary?) is the fear of Friday the thirteenth, and it’s a type of triskaidekaphobia, which is the fear of number 13 in general.
Getting back to the markets, gold moved to new highs today, while the dollar moved lower. In particular, dollars performance vs. the Japanese yen seems critical.
Let’s start with gold’s chart.
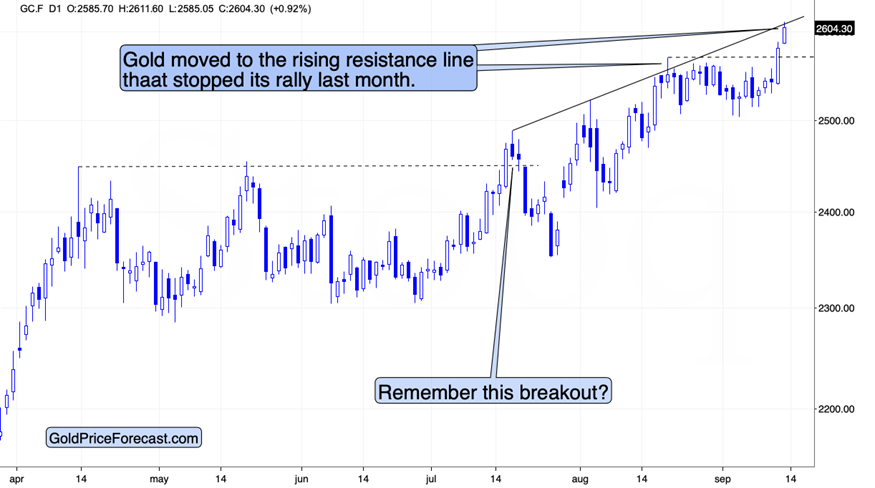
Gold moved above the mid-August high, and it just moved slightly above its rising resistance line – the same line that stopped the rally in August. Is this a top? This could be the case.
Is this a major breakout? It’s still not confirmed.
Remember the mid-July breakout above the previous highs? Yes, gold did ultimately move above them, but the mid-July breakout itself was invalidated and followed by quite visible declines. On the first day of the breakout, it closed visibly above the previous highs and on the second day it first moved higher (just like what we see today) and then gold moved back down, but without invalidating the breakout. Ultimately, gold invalidated the breakout on the fourth day after it happened.
Today is the second day after the breakout and gold already moved back down a bit after moving above the rising resistance line.
Is a confirmed breakout here and a bullish turn of events possible here? Yes. Has it happened yet? No.
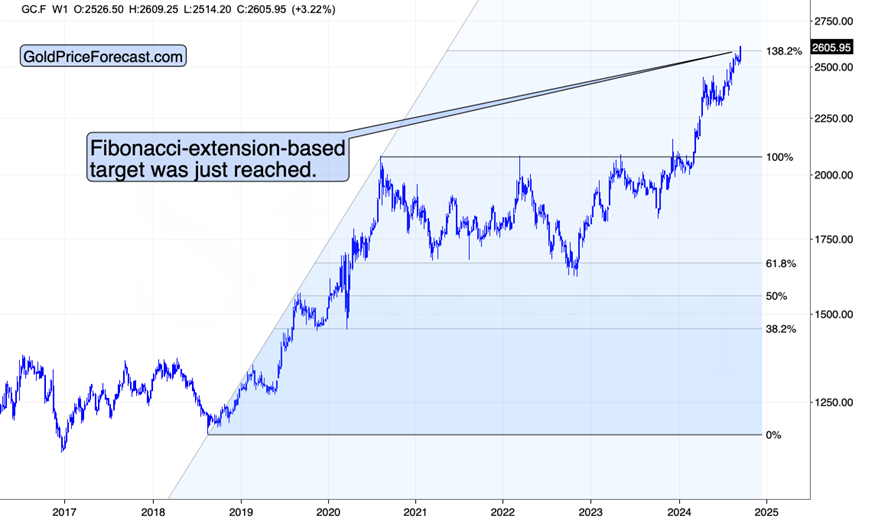
On a more long-term chart, we see that based on gold’s most recent upswing, it reached it’s Fibonacci-extension-based target, which means that perhaps what was likely happen based on this technique, has already happened.
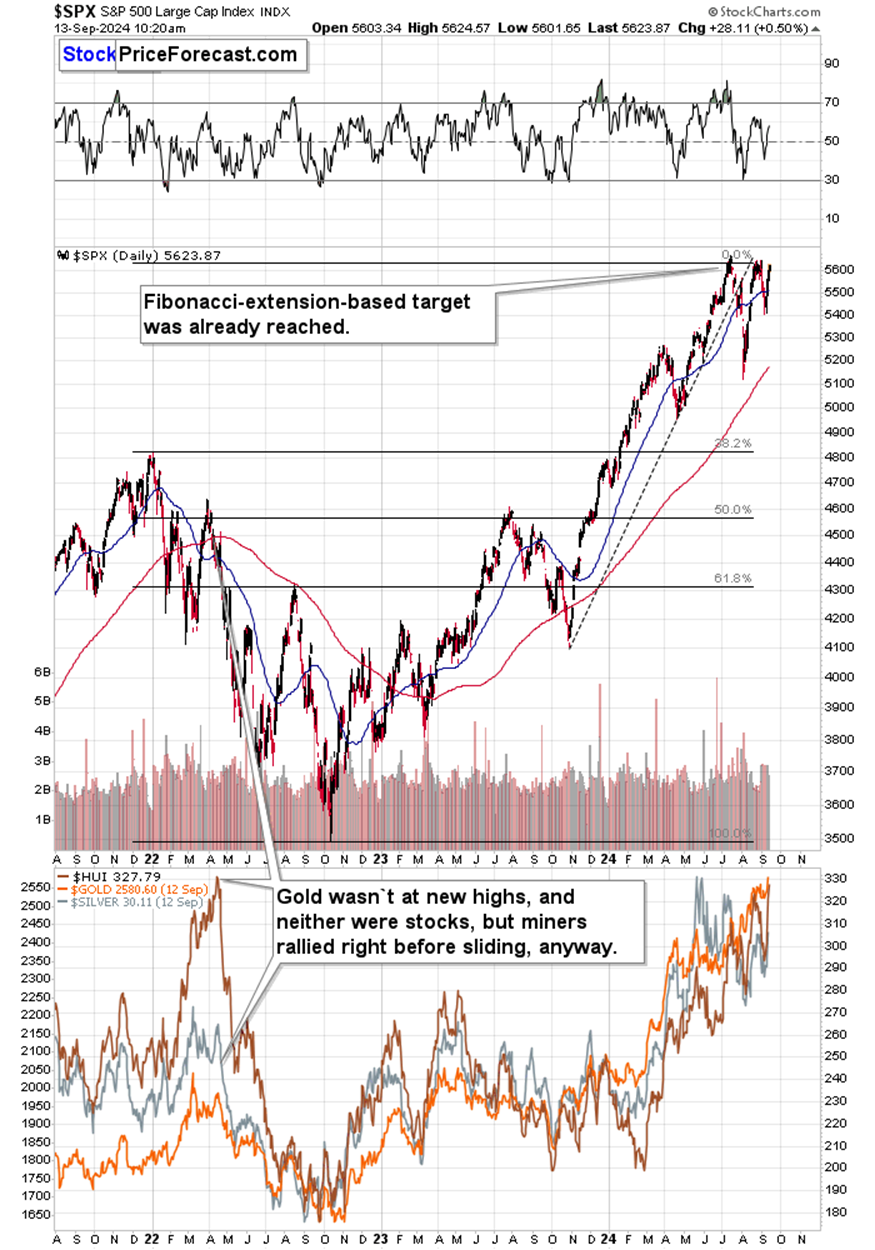
This technique (applied in a slightly different way) provided us with the target for the S&P 500 – it topped only slightly above the target.
USD/YEN at critical support levels
That’s as far as gold is concerned, but something just as important is taking place in the USD/YEN currency pair.
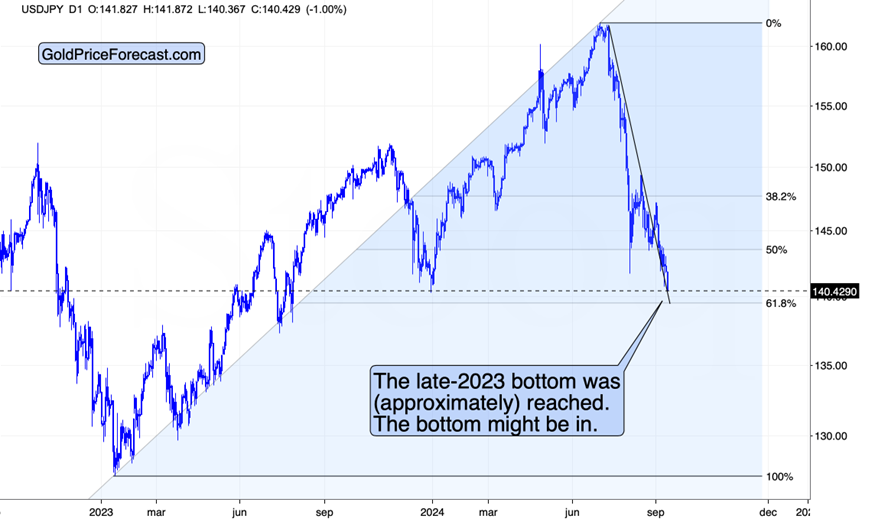
The USD/YEN just moved to its late-2023 bottom, which serves as very strong support. The same goes for the sharply declining support line – it was just reached.
The 61.8% Fibonacci retracement based on the 2023-2024 rally is also quite close.
This is a powerful combination of factors, which is very likely to trigger a rally. And on top of it, we have a self-similarity in terms of shape of the price movement to the way in which USD/YEN bottomed in late-2023. There was an initial bottom, then a sharp rally, then a lower low (in this case, we had an intraday low on Wednesday), then another rebound and finally the third – and final – low that was even lower.
If the history rhymes, and the USD/YEN rallies here, other markets might also repeat what they did at the beginning of 2024. In case of the precious metals market, it implies declines.
Speaking of time analogies, let’s keep in mind the overall bearish time of the year for gold – it’s after the U.S. Labor Day.
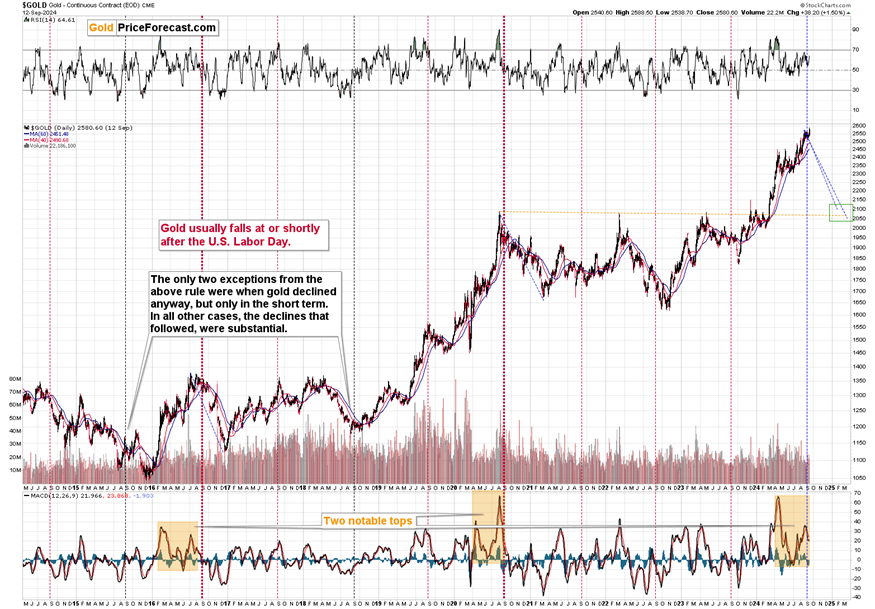
I already discussed the above chart in greater detail, so today, I’d like to show you what happened – precisely – in the two most similar cases to the current year – in 2016 and 2020.
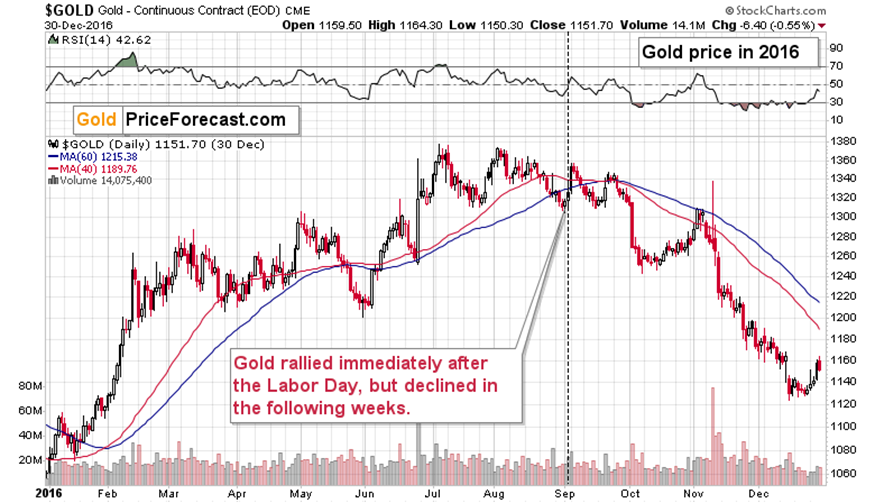
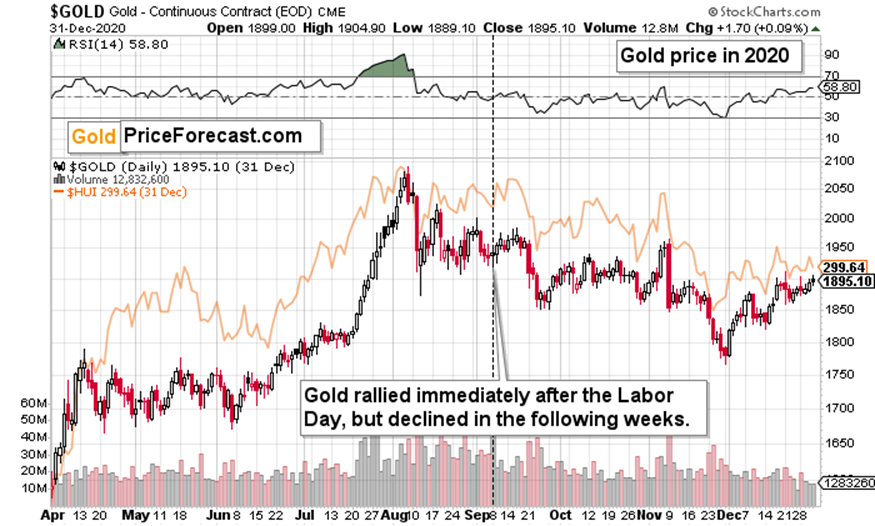
It turns out that in both cases, gold did not decline immediately after the Labor Day. Conversely, it moved higher. The point is, however, that this move up – again, in both cases – was short-lived.
Gold soon erased those gains and then declined more – much more.
Why am I bringing this up right now? Because I want to emphasize that this week’s move higher in gold does NOT invalidate the overall tendency for it to move lower after the Labor Day. It doesn’t have to happen immediately. And if you go back to the chart featuring the price moves following the previous Labor Days, you’ll see that the declines were well worth waiting for.
Want free follow-ups to the above article and details not available to 99%+ investors? Sign up to our free newsletter today!
Want free follow-ups to the above article and details not available to 99%+ investors? Sign up to our free newsletter today!
Author

Przemyslaw Radomski, CFA
Gold Price Forecast
Przemyslaw Radomski, CFA (PR) is a precious metals investor and analyst who takes advantage of the emotionality on the markets, and invites you to do the same. His company, Sunshine Profits, publishes analytical software that any