|

Gold struggling for a bid

Gold struggling for a bid

Executive summary

  • Trend Bias: Gold (XAU/USD) appears to be stuck within wave ((y)) of a larger corrective downtrend.
  • Gold may find support near $3,650 if the downtrend continues.
  • A bounce above $4,500 would be unexpected and may hint a more important bottom has been found.

Gold’s downtrend has been in place for most of 2026. The downtrend appears incomplete, though support is quickly approaching near $3,650.

Current Elliott Wave analysis
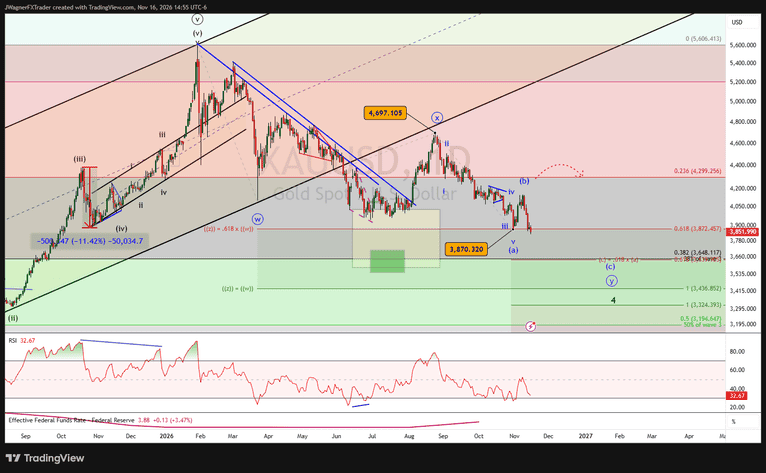
Chart

The current Elliott wave count for gold shows the yellow metal is in wave ((y)) of 4, a correction of the large rally leading up to January 2026.

Wave ((y)) would need to take shape of a bearish zigzag labeled (a)-(b)-(c). Wave (a) of the bearish zigzag completed at the 3,870 low on October 30.

The rally to 4,148 is either all of wave (b) or part of wave (b). Either way, another decline in wave (c) is needed to finalize the pattern.

If gold rallies from current levels, it would hint that wave (b) is ongoing as an expanded flat or triangle pattern.

If gold continues to fall and reaches 3,650, then we’ll consider wave (c) of ((y)) of 4 is maturing and nearing its completion.

There are a couple of wave relationships sitting near 3,650.

The 38% Fibonacci retracement level of wave 3 is at 3,648. 

Additionally, wave (c) of ((y)) is a 61.8% Fibonacci extension of wave (a) of ((y)) at 3,640.

Additionally, we highlighted Ichimoku cloud support for the lagging line in the Q4 2026 Gold forecast.

It is unusual for several wave relationships of different time frames coinciding near the same level.

As a result, gold may build a bullish base and rally from support near 3,650 once it arrives there.

In the unforeseen event that gold rallies above 4,500 without reaching 3,650, then we’ll need to re-consider the downtrend as complete.

Bottom line

Gold appears to be declining in wave ((y)) of 4, a larger bearish double zigzag pattern. The pattern is mature but more downside potential remains. 

If this is correct, then gold would continue its decline to near 3,650 where several wave relationships sit and a base of support may develop.

If gold prices push above 4,500, then we’ll reconsider the possibility that a major low may be in place.

Author

Zorrays Junaid

Zorrays Junaid

Alchemy Markets

Zorrays Junaid has extensive combined experience in the financial markets as a portfolio manager and trading coach. More recently, he is an Analyst with Alchemy Markets, and has contributed to DailyFX and Elliott Wave Forecast in the past.


More from Zorrays Junaid
Share:

Editor's Picks

AUD/USD remains depressed below 0.6750 after RBA minutes

AUD/USD treads water below 0.6750 in Asia on Tuesday, struggling near ten-month lows. The pair fails to find any inspiration from RBA Governor Bullock’s hawkish remarks. Moreover, Minutes from the November RBA meeting also had little impact on the Australian Dollar amid a bullish US Dollar undertone, bolstered by firming Fed hike bets and geopolitical uncertainties.

USD/JPY holds steady around 156.50 as 'Yentervention' risks loom

USD/JPY is consolidating around mid-156.00s in the Asian session on Tuesday as traders stay on high alert amid speculation that authorities will step in to support the Japanese Yen. Meanwhile, the US Dollar holds its recent gains at a 19-month high, amid firming Fed rate-hike bets and geopolitical uncertainty. This, along with the wide US-Japan rate differential, acts as a tailwind for the pair.


Gold stays vulnerable amid Fed hike bets, geopolitical uncertainty

Gold sellers take a breather before targeting October 2025 lows near $3,820 early Tuesday. US Dollar renews 19-month highs amid US-Iran woes and hawkish Fed rhetoric. Gold’s daily technical setup suggests downside risks remain ahead of Wednesday’s Fed Minutes.

XRP revisits November 2024 levels, XLM hits a two-year low
Ripple (XRP) and Stellar (XLM) tumble as bears show no signs of backing down. With both altcoins under pressure on Tuesday, XRP revisits November 2024 levels, and XLM hit a two-year low last week. Meanwhile, deteriorating on-chain metrics and bearish technical indicators suggest further downside risk, despite both tokens entering oversold conditions.
The week ahead: Questions for the new Nvidia CEO, Anthropic’s IPO and economic data dump
The tech stock rout does not look to be over, and could be broadening as we start a new week. Nvidia’s stock price is lower by another 2% in the pre market, and its rivals, that had benefited from the chip giant’s initial demise, are also playing catch up this morning. AMD’s share price is lower by 4.2% in early trading, even though it eked out a gain last week.
Gold isn't being sold for thew reason most people think
Gold (XAU/USD) remains under heavy selling pressure on Monday, hitting its lowest level in 13 months. The precious metal is struggling to recover despite escalating geopolitical tensions in the Middle East, a backdrop that would normally encourage investors to seek protection in safe-haven assets. However, the main driver behind Gold's decline is not the geopolitical uncertainty itself.