Gold: Prior floor becomes resistance — NFP breaks the structure and bears own the tape

1. Macro and fundamental backdrop
Friday's NFP report did the damage. The US economy added 172K jobs in May — double the 85K consensus — with April revised higher from 115K to 179K. Unemployment held at 4.3%. The DXY jumped to 99.81, its highest level since April 7. The 10-year Treasury yield rose 8 basis points to 4.53%. Gold fell 3.29% on the day and closed at a three month low.
The Fed's path is now cleaner in one direction. Warsh chairs his first FOMC meeting on June 16 and 17. Markets have priced a 96.9% probability of a hold, but the statement language is the real watch — specifically whether the committee formally reintroduces rate hike guidance. A strong NFP followed by a hot CPI on June 11 would make that language very difficult to avoid.
US and Iran
Peace talks remain stalled. CENTCOM confirmed the ceasefire is technically ongoing, but no formal agreement has been signed and Trump has not approved the proposed 60 day extension. With Strait of Hormuz uncertainty unresolved, oil remains elevated and the inflation argument stays intact — supportive for the dollar and further pressure on gold.
Central bank demand
Sovereign accumulation continues at pace but does not reverse structural price damage from a single session. The 244 tonnes purchased in Q1 2026 sets a long term floor, not a weekly support level. This week, that distinction matters.
The macro environment is uniformly bearish for gold right now. A strong labour market, rising yields, a bid dollar, an unresolved inflation story, and an incoming Fed Chair with no incentive to sound dovish — every variable is pointing the same way.
2. Technical structure — 4H primary timeframe
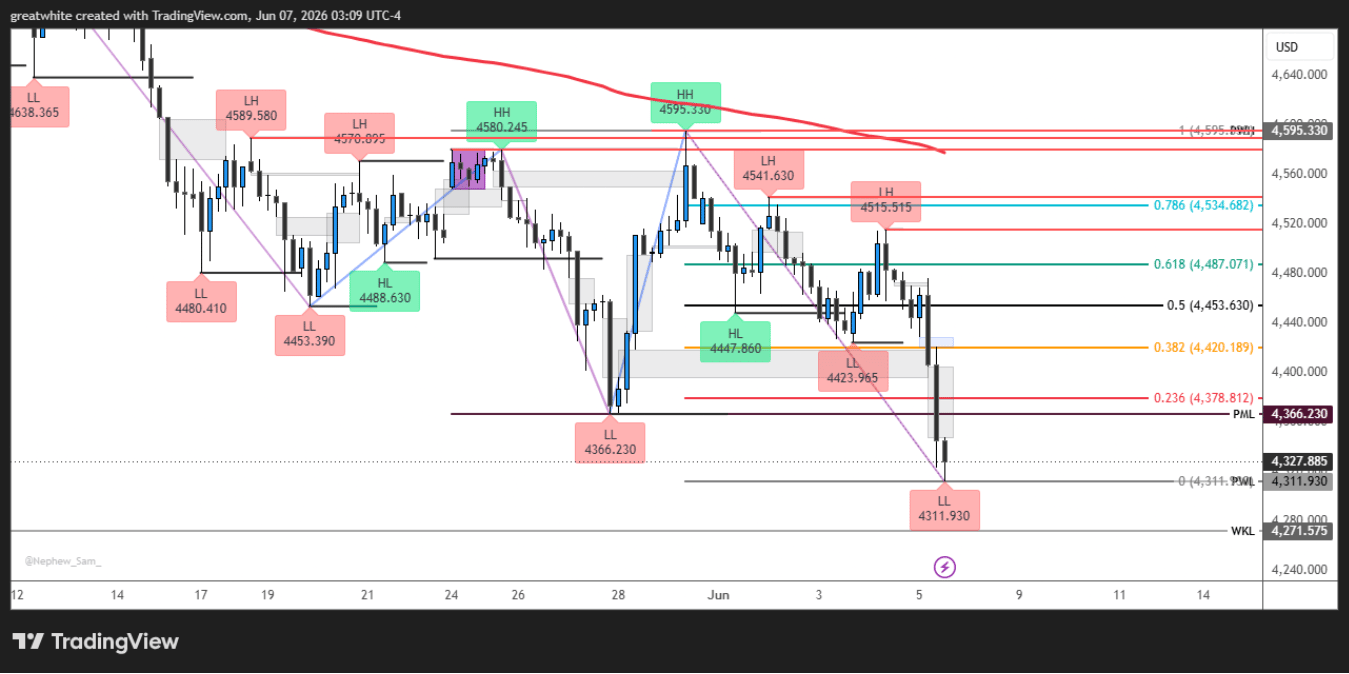
Gold is sitting $15.96 above a new structural low, with the prior floor overhead as resistance and no confirmed demand below. The chart is compressing at the base of a confirmed break of structure. That is the context for everything that follows this week.
The prior floor at $4,366.23 held through April and May. It absorbed the April sweep. It held as the base for the May recovery that took price to $4,595.33. Every analysis since May 17 referenced it as the structural reference point — and the May 29 outlook stated explicitly that a daily close below it would invalidate the bullish thesis. Friday delivered that close, and then some. Price closed at $4,327.89 — $38.35 below the floor — on a bearish engulfing candle with volume running 43% above the five bar average.
The distinction between this breakdown and the liquidity sweeps seen in April and May is important. In those instances — the SSL cluster at $4,510/$4,501 in April, the sweep of $4,453.39 on the lower low in May — institutional absorption followed the sweep. Price reversed, closed back above the level, and structure recovered. None of that happened here. Friday produced no wick recovery. No close back above $4,366.23. No absorption candle. Volume expanded into the close rather than fading. That is not a sweep. That is a Break of Structure with distribution. The May 27 to 29 recovery from $4,366.23 to $4,595.33 — described in the May 29 article as a structural shift — is now classified as a bull trap. The Change of Character has confirmed bearish.
The Fibonacci range has been reanchored to the new structural swing: $4,311.93 (Friday's low) to $4,595.33 (the May 28 high). Every level within that range is now resistance, not support. The 0.236 retracement at $4,378.81 is the nearest overhead level. Any bounce that stalls there and rejects is the first short opportunity of the week.
Market structure summary
- 10th consecutive Lower High from the $5,602 all time high — the broader downtrend is intact and accelerating
- Prior floor $4,366.23 breached on daily close — now resistance; reclassified from demand to supply
- New structural low: $4,311.93 — unretested; a daily close below opens $4,250 and $4,200
- Fibonacci range reanchored: $4,311.93 to $4,595.33 — all levels within are resistance on any bounce
- Bearish BOS confirmed: Friday candle was a bearish engulfing at 43% above average volume — no absorption, no recovery close
Level | Type | Significance |
4,595.33 | Prior Swing High — Structural Ceiling | Origin of the reanchored Fibonacci range. A daily close above this level is the only condition that forces a full structural reassessment. |
4,534.68 | 0.786 Fibonacci — Resistance | Deep retracement reference within the recovery swing. Approached only in a strong corrective rally; supply zone for short entries. |
4,487.07 | 0.618 Fibonacci — Resistance | Key supply level within the corrective rally structure. Expect sell side interest at this zone on any bounce that extends beyond 4,453. |
4,453.63 | 0.500 Fibonacci — Equilibrium Resistance | Midpoint of the 4,311.93 to 4,595.33 swing. The most likely ceiling for any corrective move before bearish continuation resumes. |
4,420.19 | 0.382 Fibonacci — Resistance | First meaningful supply reference above the prior floor. Any rally that stalls here and rejects keeps the primary bearish case intact. |
4,378.81 | 0.236 Fibonacci — Nearest Resistance | Closest overhead level above current price. A stall or rejection here on the first bounce is the highest probability short entry this week. |
4,366.23 | Prior Monthly Low — Now Resistance | The floor that held through April and May. Price closed $38.35 below it on Friday. Any rally back into this level is a supply reference, not support. |
4,327.89 | Current Price | Trading $15.96 above Friday's structural low. Price is compressing at the base of a confirmed bearish break of structure. |
4,311.93 | Previous Week Low — New Structural Floor | Friday's confirmed low. The first downside reference for a continuation break. A daily close below this level opens the path toward 4,250 and then 4,200. |
4,250.00 | Psychological Level — First Extension Target | Next significant psychological reference below the structural low. Activated on a sustained daily close below 4,311.93. |
4,200.00 | Extended Downside Target | Secondary extension target below 4,250. Deep structural support; relevant if 4,250 fails to produce a meaningful reaction. |
3. Key zone analysis
The single most important zone entering the week is $4,366.23. It held as the structural floor for six weeks. It now flips to resistance. Any bounce that reaches this level and produces a bearish rejection candle on the 4H — engulfing, shooting star, or strong close back below $4,378.81 — is the highest probability short entry in the current framework. A daily close back above $4,366.23 would be the first signal that buyers are attempting to reclaim lost ground and would require reassessment of the bearish bias.
Below current price, $4,311.93 is the only structural reference. Price is $15.96 above it as this article goes to print. The first test of a new structural low rarely holds cleanly — but the character of the test matters. A false break with rapid recovery and a daily close back above $4,327 would suggest base building. A sustained break and close below $4,311.93, with volume confirmation, opens $4,250 then $4,200 with no meaningful structural support between those levels.
4. Scenario based trade framework
Scenario 1 — Bearish continuation (primary bias)
Trigger: Any bounce that stalls at or below $4,366.23 produces a 4H bearish rejection candle. Bears reload at prior support now acting as resistance. Alternatively: a direct daily close below $4,311.93 with volume expansion.
Expected path: Bounce toward $4,378.81 or $4,366.23 → rejection → break below $4,311.93 → $4,250 → $4,200
- Entry: Short on a 4H bearish rejection candle at $4,366.23 to $4,378.81. Confirm with a close below the candle low before entry. Second entry on a daily close below $4,311.93 with a retest of that level.
- T1: $4,250 — first psychological and structural reference below the new low
- T2: $4,200 — extended downside target on sustained bearish follow-through below $4,250
- Stop: Above $4,400 on the $4,366 rejection entry. Above $4,330 on the $4,311 break entry.
Scenario 2 — Corrective bounce before continuation (reactive)
Trigger: Price holds above $4,311.93 and stages a corrective rally toward the 0.382 to 0.500 Fibonacci range between $4,420.19 and $4,453.63.
Expected path: $4,327 → $4,378.81 (0.236) → $4,420.19 (0.382) → $4,453.63 (0.500) before sellers reassert
- Execution: No longs anticipated in this scenario. Monitor price behaviour at the 0.236 and 0.382 levels for bearish rejection confirmation before positioning short.
- If price reaches $4,453.63 without a daily close above $4,595.33, the corrective rally is complete and Scenario 1 entries become active at that supply level.
- Do not chase the bounce. A corrective move within a bearish BOS environment is not a structural reversal.
Scenario 3 — Bullish structural reversal (very low probability)
Trigger: A daily close above $4,595.33 — the origin of the reanchored Fibonacci range and the prior swing high. This is the only level that forces a full structural reassessment.
Structural consequence: A close above $4,595.33 reclaims the May 28 high, invalidates the current BOS sequence, and reopens the discussion toward $4,644.31 and the broader daily FVG structure above.
- Entry logic: Do not enter on the initial break. Wait for a retest of $4,595.33 from above on the 4H with a confirming bullish candle — evidence that former resistance has converted to demand before committing.
- T1: $4,644.31 — upper edge of the daily bearish FVG from the May analysis
- T2: $4,709.88 — the 0.5 extension of the prior recovery swing
- Stop: Below $4,560 on the retest entry. A close back below that level signals the break was false and the supply zone is still active.
- Probability: Very low. NFP printed 172K against an 85K consensus. The DXY is at 99.81. The 10-year yield is at 4.53%. Warsh's first FOMC meeting is nine days away. Getting from $4,327 to $4,595 requires a CPI miss on June 11, a dovish surprise from Warsh on June 17, or a ceasefire agreement — and likely a combination of all three. None of those outcomes is priced as a base case.
5. Risk events and catalysts — Week of 8 June 2026
June 11 — CPI (May)
The most important data point of the week and the final inflation read before Warsh's first FOMC. A hot print above 3.5% year on year accelerates the rate hike narrative and adds to gold's downside. A meaningful undershoot is the only near term catalyst capable of reversing the current structure.
June 16 to 17 — FOMC meeting (Warsh)
No cut is expected — the probability of a hold sits at 96.9%. What markets are watching is the statement language. Any formal reintroduction of rate hike guidance, or a hawkish press conference from Warsh, would drive the dollar higher and confirm the next leg lower for gold.
US and Iran peace talks (ongoing)
The ceasefire holds technically but no deal has been signed. A formal agreement removes the energy inflation argument and produces a relief bounce. A breakdown in talks spikes oil, lifts inflation expectations, and adds complexity to the Fed's June decision — ambiguous for gold in the immediate term.
6. Summary and directional bias
Gold is pinned $15.96 above a new structural low with the prior floor at $4,366.23 now acting as resistance overhead. The weekly candle closed down $192.91 — the worst week since the selloff began. Friday's break below $4,366.23 was not a liquidity sweep. There was no absorption candle, no recovery close, no institutional response at the level. It was a clean Break of Structure on above average volume, and the prior bullish thesis from the May 29 article has been fully invalidated.
Any bounce that stalls at $4,366.23 or $4,378.81 and rejects is the primary short opportunity. A close below $4,311.93 opens $4,250 and $4,200. The bullish case does not reopen until price reclaims $4,366.23 on a daily close — and even then it requires reassessment rather than immediate conviction.
BULLISH ABOVE | NEUTRAL BETWEEN | BEARISH BELOW |
4,366.23 Prior floor reclaimed; bull case reopens | 4,311.93 – 4,366.23 Compression at structural base; await directional close | 4,311.93 Break of new low confirmed; targets 4,250 → 4,200 |
Author

Martin Nwankwo
TradingPRO
Technical Market analyst with over a decade of forex experience, an ICT chartered student.


