- Gold awaits a strong catalyst to break through the key $1800 barrier.
- Falling Treasury yields and DXY remain a key driver for gold’s upside.
- A test of rising wedge hurdle at $1802 on the 4H chart likely amid bullish RSI.
Gold (XAU/USD) rallied to hit fresh two-month highs at $1798 on Wednesday, helped by the renewed weakness in the US Treasury yields, which eventually dragged the dollar. The returns on the market tumbled once again amid resurfacing concerns over the economic recovery, as the covid surge globally continues to overwhelm. However, the solid rally lost strength once again just shy of the $1800 barrier, as the latter continues to act as a critical technical level. Meanwhile, the rebound in Wall Street indices also helped limit gold’s advance.
In Thursday’s Asian trading, gold bulls took a breather above $1790, as they await a strong catalyst to resume the uptrend. The sell-off in the Treasury yields could deepen if the market mood worsens on a likely cautious outlook on the economy from the European Central Bank (ECB). The ECB is widely expected to maintain its current monetary policy settings when they meet later in the European session today. Meanwhile, the dovish Fed expectations could continue to offer support to the non-interest-bearing gold, as the focus also remains on the US weekly Jobless Claims for fresh incentives.
Gold Price Chart - Technical outlook
Gold: Four-hour chart
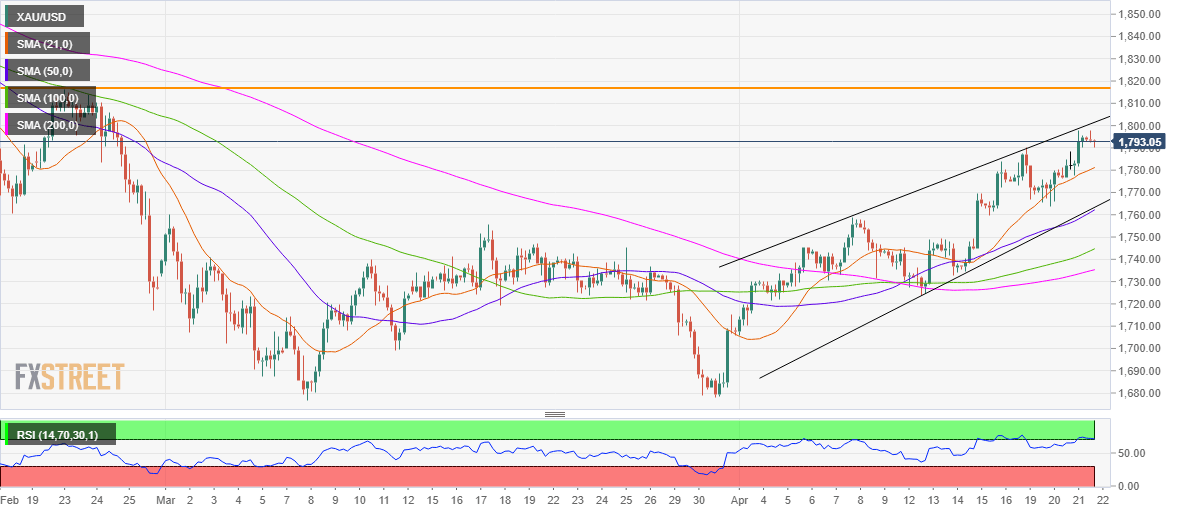
As observed on the four-hourly chart, gold faced rejection once again at the rising wedge hurdle, then at $1797/98.
Despite the pullback, it remains on the track to test that key barrier, now seen at $1802.
Supporting the bullish case, the Relative Strength Index (RSI) has reversed slightly from the overbought territory while trading well above the midline.
Gold buyers remain hopeful so long as the price holds above the 21-simple moving average (SMA) support at $1781.
A sustained move below the latter could expose the confluence zone of the wedge support and ascending 50-SMA at $1763.
Alternatively, a four-hourly candlestick close above $1802 could open the gates towards the horizontal (orange) trendline resistance at $1816.
Ahead of that target, the 100-day SMA at $1804 could test the bullish commitments.
Information on these pages contains forward-looking statements that involve risks and uncertainties. Markets and instruments profiled on this page are for informational purposes only and should not in any way come across as a recommendation to buy or sell in these assets. You should do your own thorough research before making any investment decisions. FXStreet does not in any way guarantee that this information is free from mistakes, errors, or material misstatements. It also does not guarantee that this information is of a timely nature. Investing in Open Markets involves a great deal of risk, including the loss of all or a portion of your investment, as well as emotional distress. All risks, losses and costs associated with investing, including total loss of principal, are your responsibility. The views and opinions expressed in this article are those of the authors and do not necessarily reflect the official policy or position of FXStreet nor its advertisers. The author will not be held responsible for information that is found at the end of links posted on this page.
If not otherwise explicitly mentioned in the body of the article, at the time of writing, the author has no position in any stock mentioned in this article and no business relationship with any company mentioned. The author has not received compensation for writing this article, other than from FXStreet.
FXStreet and the author do not provide personalized recommendations. The author makes no representations as to the accuracy, completeness, or suitability of this information. FXStreet and the author will not be liable for any errors, omissions or any losses, injuries or damages arising from this information and its display or use. Errors and omissions excepted.
The author and FXStreet are not registered investment advisors and nothing in this article is intended to be investment advice.
Recommended Content
Editors’ Picks
AUD/USD failed just ahead of the 200-day SMA

Finally, AUD/USD managed to break above the 0.6500 barrier on Wednesday, extending the weekly recovery, although its advance faltered just ahead of the 0.6530 region, where the key 200-day SMA sits.
EUR/USD met some decent resistance above 1.0700

EUR/USD remained unable to gather extra upside traction and surpass the 1.0700 hurdle in a convincing fashion on Wednesday, instead giving away part of the weekly gains against the backdrop of a decent bounce in the Dollar.
Gold keeps consolidating ahead of US first-tier figures

Gold finds it difficult to stage a rebound midweek following Monday's sharp decline but manages to hold above $2,300. The benchmark 10-year US Treasury bond yield stays in the green above 4.6% after US data, not allowing the pair to turn north.
Bitcoin price could be primed for correction as bearish activity grows near $66K area

Bitcoin (BTC) price managed to maintain a northbound trajectory after the April 20 halving, despite bold assertions by analysts that the event would be a “sell the news” situation. However, after four days of strength, the tables could be turning as a dark cloud now hovers above BTC price.
Bank of Japan's predicament: The BOJ is trapped

In this special edition of TradeGATEHub Live Trading, we're joined by guest speaker Tavi @TaviCosta, who shares his insights on the Bank of Japan's current predicament, stating, 'The BOJ is Trapped.'