Gold Price Forecast: XAU/USD looks to US PCE inflation and 100 DMA for further upside
- Gold price trades close to monthly highs near $1,950, awaiting key US PCE inflation data.
- Dismal US data weigh on US Dollar and Treasury bond yields, suggesting the end to the Fed’s tightening.
- Gold price needs to take out the key 100-Daily Moving Average at $1,955 to extend the uptrend.

Gold price is trading firmer close to the monthly high reached at $1,949 on Wednesday, as the US Dollar licks poor economic data-inflicted wounds early Thursday. Investors turn cautious amid China’s economic gloom while awaiting the US Federal Reserve’s (Fed) preferred inflation gauge, the Personal Consumption Expenditures (PCE) - Price Index data due later in the North American trading on Thursday.
Spotlight on US PCE inflation data
Wednesday’s US Automatic Data Processing (ADP) Employment Change and the second estimate of the Q2 Gross Domestic Product (GDP) surprised to the downside, bolstering expectations of an end to the Federal Reserve tightening cycle. Markets also began pricing rate cuts next year, which could amount to more than 100 basis points, after the latest run of disappointing US economic data released earlier this week.
ADP on Wednesday reported that the US private sector added 177,000 jobs in August, well below the revised total of 371,000 added in July. US Q2 GDP growth was revised down to a 2.1% annual rate from 2.4% seen in the preliminary reading. On Tuesday, US JOLTS Job Openings dropped to the lowest level in over two years to 8.827M in July. Meanwhile, US Consumer Confidence fell sharply to 106.1 in August after two straight monthly increases.
In the face of weak US economic indicators, the selling pressure around the US Dollar remains unabated, compared with its main counterparts. The US Dollar Index is wallowing in two-week lows near 103.00, as the US Treasury bond yields also feel the pinch from the renenewed dovish Fed bets. The benchmark US 10-year Treasury bond yields are consolidating near three-week lows of 4.08%, having extended its correction from a 16-year top of 4.3660.
The ongoing bearish momentum in the US Dollar and the US Treasury bond yields is helping Gold price recover losses incurred in the first half of this month. The Greenback also bore the brunt of a fresh EUR/USD rally after Germany’s annual Harmonized Index of Consumer Prices rose 6.4% in August when compared to the 6.2% expected clip and the previous increase of 6.5%. The headline annual Consumer Price Index (CPI) also advanced 6.1%, beating estimates of 6.0% and against the previous growth of 6.2%. Less than expected slowdown in the German inflation ramped up bets that the European Central Bank will have to hike in September, fuelling fresh upside in the Euro against the US Dollar.
So far this Thursday’s trading, Gold price holds the recent upside, as the US Dollar remains on the back foot, as traders refrain from placing fresh bets on the buck ahead of the key US PCE inflation data due later in the day and Friday’s Nonfarm Payrolls release. Investors also stay wary amid looming China slowdown worries, especially after the country’s Manufacturing PMI contracted for the fifth straight month in August. China is the world’s biggest Gold consumer and, hence, dwindling economic recovery is likely to weigh on the Gold price.
Gold price technical analysis: Daily chart
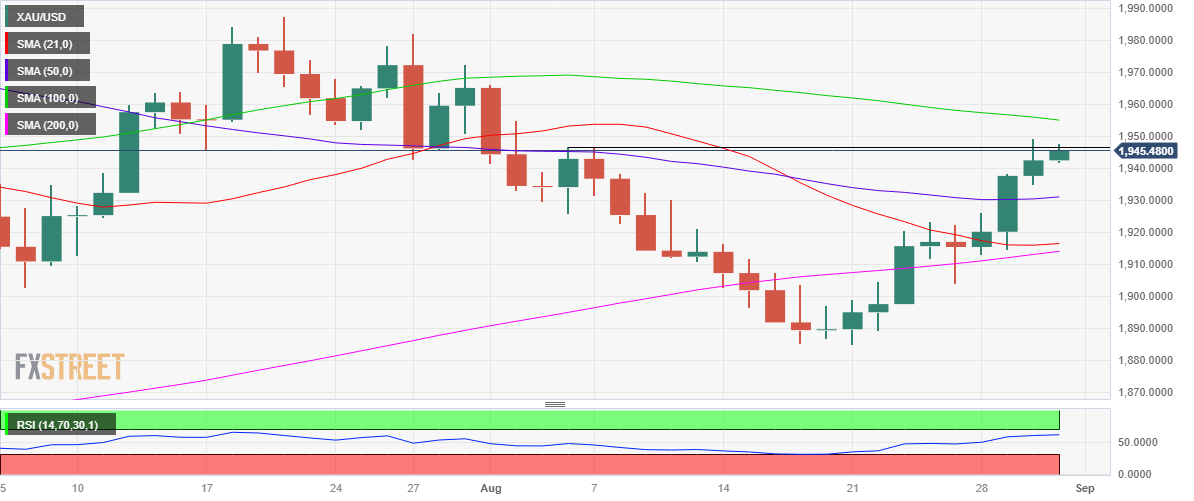
Gold price is closing in on the critical 100-Daily Moving Averages (DMA) at $1,955, as buyers appear relentless after the technical indicators turned bullish earlier this week.
The 14-day Relative Strength Index (RSI) is looking north, heading toward the overbought territory while above the midline. The indicator suggests that there is more room for the upside.
Daily closing above the 100 DMA barrier at $1,955 will call for a test of the static resistance at $1,970, above which doors will open up toward the $2,000 mark.
Alternatively, any pullback in Gold price will meet initial demand at the previous day’s low of $1,935.
The 50 DMA resistance-turned-support of $1,931 could emerge as the next powerful support. Gold sellers will then target the strong support around the $1,913 level, which is the confluence of the 21 and 200 DMAs.
Premium
You have reached your limit of 3 free articles for this month.
Start your subscription and get access to all our original articles.
Author

Dhwani Mehta
FXStreet
Residing in Mumbai (India), Dhwani is a Senior Analyst and Manager of the Asian session at FXStreet. She has over 10 years of experience in analyzing and covering the global financial markets, with specialization in Forex and commodities markets.


