Gold Price Forecast: Bull-bear tug-of-war extends for XAU/USD ahead of Trump-Xi meet
- Gold turns south below $4,350 early Wednesday, but maintains this week’s range.
- US Dollar holds firm near two-month highs as hawkish Fed bets counter diplomacy hopes.
- Gold’s daily technical setup keeps showing a mixed picture, with a neutral RSI.
Gold has come under fresh selling pressure, struggling near $4,350 in Asia on Wednesday, retracing a part of the previous rebound from sub-$4,300 levels.
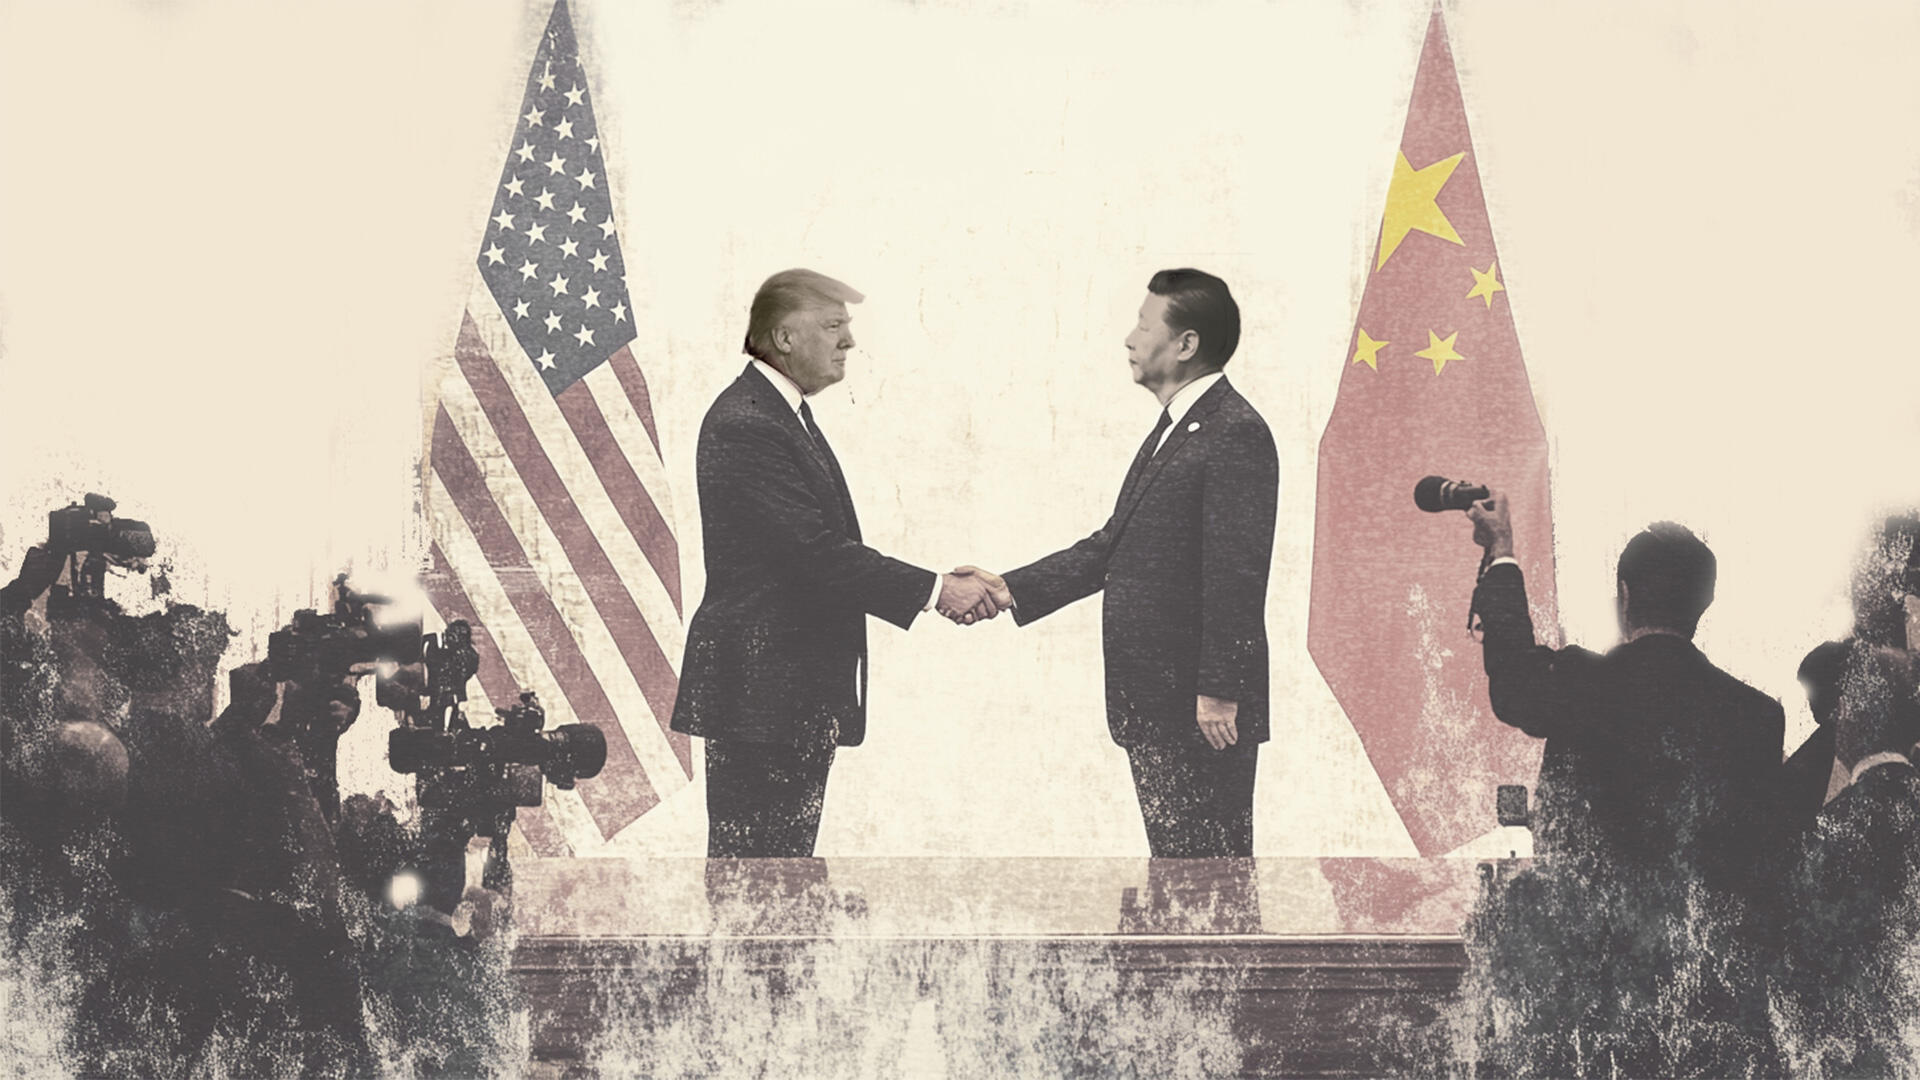
Traders are refraining from placing fresh directional bets on the bullion ahead of the highly anticipated meeting between US President Donald Trump and his Chinese counterpart Xi Jinping due later this week.
Gold: All eyes on the Trump-Xi meet
Despite the latest downtick, Gold remains confined in a familiar range seen so far this week, lacking a clear directional conviction.
Gold appears torn between retreating Oil prices and US Treasury bond yields on one side and unabated US Dollar (USD) demand on the other.
Renewed optimism about the diplomatic efforts to reopen the Strait of Hormuz and a likely US-Iran deal is weighing on Oil prices, easing inflation fears and prompting a pullback in US Treasury bond yields across the board. .
On Tuesday, Kyodo News reported, citing a senior Iranian official, that Iran will reopen the Strait of Hormuz within seven days if the US lifts its blockade.
Trump said at the UN General Assembly on Tuesday that he believes that the US and Iran will strike a deal following the US midterm elections in November.
Meanwhile, US Special Envoy to the Middle East, Steve Witkoff, said early Wednesday that mediators "shuttled between the two sides throughout the day," adding that they successfully completed a round of talks "that we hope will prove constructive and promising.”
Softer US Treasury bond yields continue to support non-yielding assets such as Gold, limiting its downside attempts.
However, the ongoing USD advance on a hawkish US Federal Reserve (Fed) interest rate outlook, further advocated by recent hawkish commentary from Fed officials, remains a drag on the bright metal.
Fed's Collins delivered a notably more hawkish tone on Tuesday, with an FXS Speechtracker score of 8.1 versus a historical average of 6.6, underscoring heightened concern about inflation staying above 2%. The explicit support for last week's rate hike and emphasis on upside inflation risks, alongside a firmer labor market footing, signal a clear willingness to keep policy restrictive until PRICE STABILITY is credibly restored. The remark that a "somewhat more restrictive" FEDERAL FUNDS RATE is needed reinforces expectations that the Dollar will remain supported by elevated US yields. The FXS Fed Sentiment Index rose by 0.53 points to 150.49, firmly in hawkish territory and consistent with the stronger-than-baseline tone captured by the FXS Speechtracker.
Additionally, traders remain unnerved and take profits off the table ahead of the Trump-Xi meeting, exerting downside pressure on Gold.
Looking ahead, the Trump-Xi Summit will be closely followed for potential impact on broad risk sentiment, the USD, and the Gold price action. In the meantime, Middle East developments will remain in play alongside Fedspeak and US S&P Global preliminary business PMI data.
US S&P Global Manufacturing PMI is seen easing to 53.5 in September from 53.9 in August, while Services PMI is also expected to tick lower to 56 in the same month from August’s 56.5.
Weaker-than-expected US PMI readings could temper hawkish Fed expectations, reinforcing bargain-buying in yieldless Gold.
Gold price technical analysis: Daily chart
In the daily chart, XAU/USD trades at $4,339.47. The metal is hovering between clustered underlying demand from the 50-day and 100-day simple moving averages (SMAs) at $4,307.31 and $4,313.57 and immediate topside pressure from the 21-day SMA at $4,388.96, leaving the near-term bias broadly neutral. The Relative Strength Index (RSI) at 48.18 sits just below the midline, hinting at indecisive momentum after the recent pullback, while the longer-term 200-day SMA up at $4,542.04 reinforces the idea of a market that has lost some upside traction but not yet shifted into a clear bearish phase.
On the downside, initial support is seen at the short- and medium-term SMAs around $4,313–4,307, ahead of the rising trend-line base near $3,999.89, which marks the deeper bullish structure if selling extends. On the topside, a daily close above the 21-day SMA at $4,388.96 would be needed to reassert the bulls and open the way for a retest of the broader resistance barrier defined by the 200-day SMA at $4,542.04.
(The technical analysis of this story was written with the help of an AI tool. Know more.)
US-China Trade War FAQs
Generally speaking, a trade war is an economic conflict between two or more countries due to extreme protectionism on one end. It implies the creation of trade barriers, such as tariffs, which result in counter-barriers, escalating import costs, and hence the cost of living.
An economic conflict between the United States (US) and China began early in 2018, when President Donald Trump set trade barriers on China, claiming unfair commercial practices and intellectual property theft from the Asian giant. China took retaliatory action, imposing tariffs on multiple US goods, such as automobiles and soybeans. Tensions escalated until the two countries signed the US-China Phase One trade deal in January 2020. The agreement required structural reforms and other changes to China’s economic and trade regime and pretended to restore stability and trust between the two nations. However, the Coronavirus pandemic took the focus out of the conflict. Yet, it is worth mentioning that President Joe Biden, who took office after Trump, kept tariffs in place and even added some additional levies.
The return of Donald Trump to the White House as the 47th US President has sparked a fresh wave of tensions between the two countries. During the 2024 election campaign, Trump pledged to impose 60% tariffs on China once he returned to office, which he did on January 20, 2025. With Trump back, the US-China trade war is meant to resume where it was left, with tit-for-tat policies affecting the global economic landscape amid disruptions in global supply chains, resulting in a reduction in spending, particularly investment, and directly feeding into the Consumer Price Index inflation.
Author

Dhwani Mehta
FXStreet
Residing in Mumbai (India), Dhwani is a Senior Analyst and Manager of the Asian session at FXStreet. She has over 10 years of experience in analyzing and covering the global financial markets, with specialization in Forex and commodities markets.