Gold price action: Strong Elliott Wave impulsive reaction from key support zone [Video]
![Gold price action: Strong Elliott Wave impulsive reaction from key support zone [Video]](https://editorial.fxsstatic.com/images/i/gold-march-05.jpg)
The short‑term Elliott Wave view in Gold (XAUUSD) shows that the yellow metal has completed a three‑swing correction from the April 17, 2026 high. The pullback unfolded as a zigzag, with wave A ending at $4499.92 and wave B at $4773.58. Gold then declined in wave C to $4365.13, completing wave (2) as seen on the one‑hour chart. This level sits inside the key support zone, where wave C equals the 100%–161.8% Fibonacci extension of wave A. The broader support area spans $4137–$4380.
After testing this zone, Gold began a strong impulsive rally. The advance signals renewed momentum, but confirmation requires a break above the April 17 peak at $4890.97, which marked the end of wave (1). In the near term, wave (i) of the new cycle should finish soon. A corrective pullback in wave (ii) is expected, addressing the cycle from the May 28, 2026 low before the rally resumes. As long as the pivot at $4365.13 holds, pullbacks should attract buyers. These retracements are likely to form in three or seven swings, supporting further upside. The structure suggests Gold has shifted from correction to impulsive advance, with the support zone providing the base for the next bullish phase.
Spot Gold 60-minute Elliott Wave chart
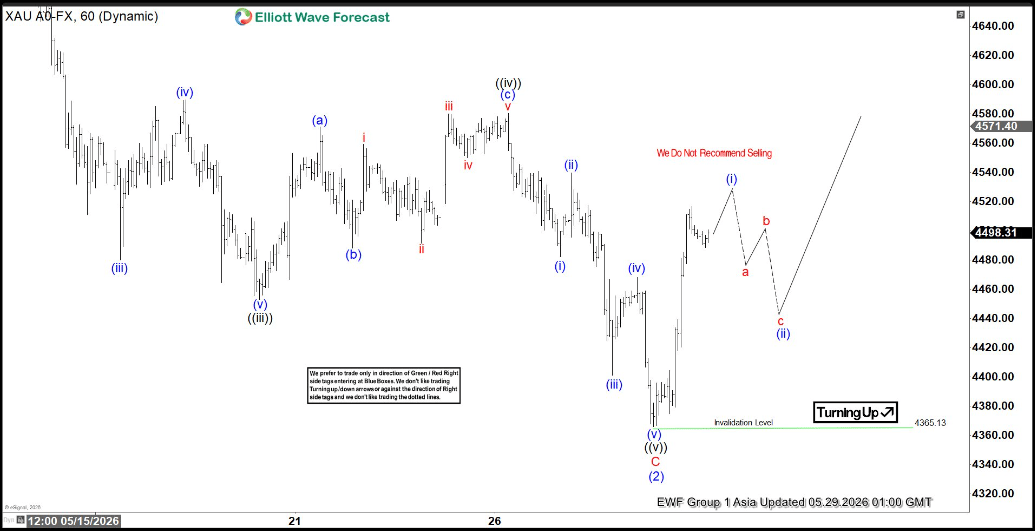
Gold Elliott Wave [Video]
Author

Elliott Wave Forecast Team
ElliottWave-Forecast.com

















