Gold outlook: Gold traders focus on the Fed’s interest rate decision

Gold bulls seem to continue to lead the precious metal’s price since our last report. The market’s dovish expectations for the Fed’s intentions may be the dominant fundamental factor underpinning the rise of gold’s price. We are also to examine whether the negative correlation of the USD with gold’s price is active and conclude the report with a technical analysis of gold’s daily chart.
Negative correlation of Gold with USD being re-activated
The negative correlation of the USD with gold’s price was an issue that always stayed in the back of gold trader’s minds. In the past week the relative stability of gold and the USD index did not allow for traders to decide whether the negative correlation of the two trading instruments is active or not for the prementioned period. Yet their movement yesterday and during today’s Asian and European session, seems to give more clues as on the one hand gold’s price managed to rise to new record high levels, while on the flip side the USD index is losing ground. The opposite direction of the two trading instruments seems to allow for analysts to highlight a possible revival of the negative correlation of the two trading instruments in the current stage, something that is understandable given the expectations for the high impact release of the Fed’s interest rate decision tomorrow. Hence should we see the USD weakening further we may see gold’s price reaching new highs, while should the USD gaining ground, it could weigh on gold’s price. Furthermore, we note that US bond yields show a relative stabilisation, yet the stabilisation is at relatively low levels which tends to make the shiny metal more attractive.
Gold traders focus on the Fed’s interest rate decision
The main event for the week for gold traders is expected to be the release of the Fed’s interest rate decision tomorrow. The bank is widely expected to remain on hold tomorrow and Fed Fund Futures (FFF) imply currently, a probability of 97.4% for such a scenario to materialise, practically implying that the market has almost fully priced in such a scenario. Yet FFF also imply that the market expects another two rate cuts to be delivered by the bank until the end of the year, one in October and one in December. Overall that tends to highlight the market’s dovish expectations for the bank’s intentions. Hence should the bank lower interest rates by 25 basis points as expected, which our base scenario as well, we may see the market’s attention being shifted towards the Fed’s forward guidance. The forward guidance is expected to be included in three elements. The first is to be the accompanying statement and should the bank signal that it’s prepared to proceed with more rate cuts in the following meetings, thus verifying the markets’ expectations, it would be an element supporting gold’s price, while a possible hesitancy on behalf of the bank to cut rates further, cut force the market to ease its dovish expectations and thus weigh on gold’s price. The second element of interest would be the bank’s new dot plot. The dot plot which is included in the banks’ projections shows where Fed policymakers expect interest rates to land at the end of 2025, 2026, 2027 and in the longer run. Should the Fed policymakers through the new dot plot exceed the market’s dovish expectations for the end of the year implying possibly a double rate cut either in the October or December meetings, the markets’ dovish expectations could be enhanced asymmetrically thus providing substantial support for gold’s price, yet such a scenario seems to be remote. On the other hand should the new dot plot imply that the bank intends to cut rates only one more time until the end of the year, we may see gold’s price falling. The last element at which the bank could provide more clues regarding its intentions would be Fed Chairman Jerome Powell’s press conference later on. The Fed Chairman could switch the market mood easily, something that he has achieved a number of times in the past. Should Fed Chairman Powell signal readiness the bank’s readiness to proceed with further easing of the Fed’s monetary policy we may see the press conference allowing for some support to build up for gold’s price. Yet should the Fed Chairman express hesitation for further easing of the bank’s monetary policy, or the extend of further easing, could weigh on gold’s price. Possible factors to watch out for in the press conference but also in the accompanying statement would be a possible over-emphasizing inflationary pressures in the US economy and at the same time downplaying the weakness of the US employment market and such elements could weigh on gold’s price and vice versa as the bank has to balance between a weak US employment market and relatively stubborn inflationary pressures in the US economy.
Technical analysis
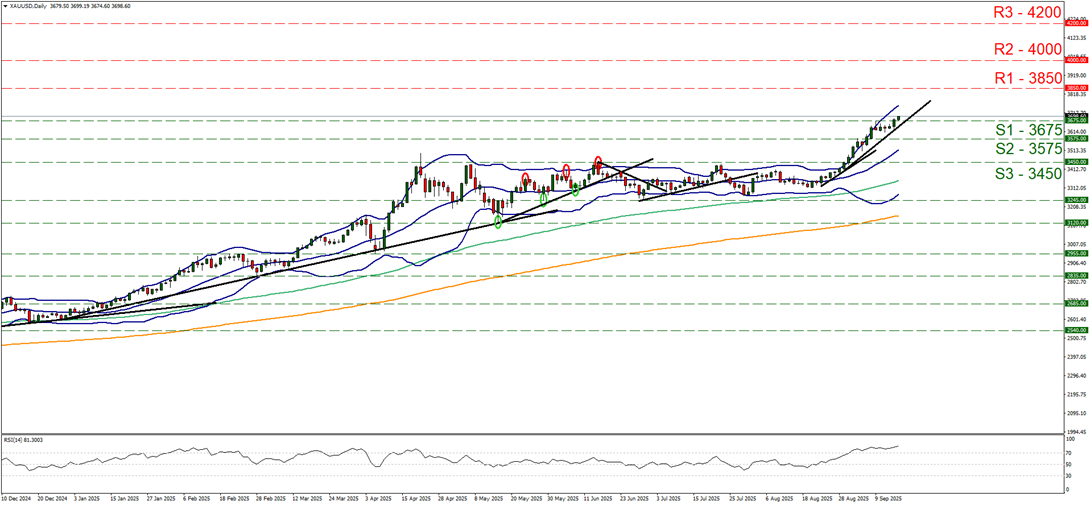
XAU/USD daily chart
-
Support: 3675 (S1), 3575 (S2), 3450 (S3).
-
Resistance: 3850 (R1), 4000 (R2), 4200 (R3).
Gold’s price was able yesterday to finally break the 3675 (S1) resistance line, now turned to support and is now reaching new record high levels after some stalling. The breaking of the $3675 per ounce level, rejuvenates the bullish outlook for the precious metal shifting the upward trendline guiding it since the 22nd of August, to the right as a new higher peak seems to be forming. At the same time the RSI indicator remains above the reading of 70 and is still rising, even slightly, showcasing a strong bullish market sentiment for the precious metal, yet at the same time warns that a correction lower for the precious metal’s price, is also possible, as gold seems to be in overbought territory. On the flip side gold’s price has been in overbought territory since the beginning of the month without any correction lower, and the distance between the upper Bollinger band and gold’s price action suggests that there is still room for the precious metal’s price to rise further. Should the bulls maintain control as expected, we may see the bullion’s price aiming for the 3800 (R1) resistance line. Should the bears take over, we may see gold’s price tumbling, breaking the 3675 (S1) support line and continue to break the prementioned upward trendline in a first signal that the upward motion has been interrupted and continue even lower to breach the 3575 (S2) support barrier and start aiming for the 3450 (S3) support level.
Author

Peter Iosif, ACA, MBA
IronFX
Mr. Iosif joined IronFX in 2017 as part of the sales force. His high level of competence and expertise enabled him to climb up the company ladder quickly and move to the IronFX Strategy team as a Research Analyst. Mr.