Gold daily: The bounce has found its feet but not yet broken free
- Simon White’s flow analysis suggested that part of the semiconductor surge was financed by money leaving gold and Bitcoin, creating the conditions for a partial reversal once chips weakened.
- Goldman’s central-bank thesis helps explain why gold retained a structural floor despite higher real yields, a stronger dollar and Fed uncertainty.
- The rebound reflects both returning private capital and continued official-sector demand.
- Gold has cleared several minor resistance levels, but the major technical ceiling remains intact.
- The market has moved from vulnerable to constructive, although a confirmed breakout still requires stronger price action and broader investment flows.

The bounce has found its feet
I want to circle back to two earlier calls that have aged rather well, at least since the call to action went out.
I hope you followed the money
The first came from Bloomberg macro strategist Simon White, who argued that some of the money driving the semiconductor surge may have been pulled from gold and Bitcoin. The second came from Goldman Sachs, whose commodities team maintained that persistent central-bank demand was placing a structural floor beneath bullion even as higher real yields, a firmer dollar and renewed Fed uncertainty weighed on the market.
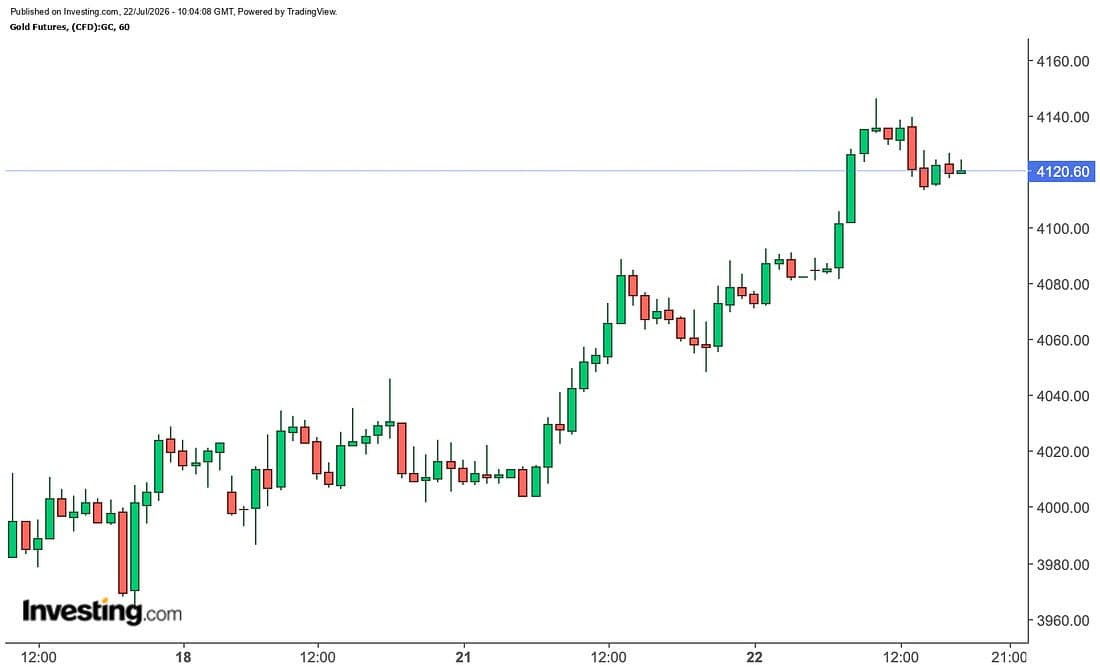
Gold has since rebounded, but I still regard the move as a bounce rather than a confirmed breakout. The market has cleared a few minor resistance levels and repaired some of the technical damage, yet the larger barriers remain intact. The tone has improved, but price has not done enough to declare that the next major leg is already under way.
Nice bounce
White’s flow argument was useful because it looked beyond the usual explanations for gold’s weakness. Rather than treating the semiconductor boom as a self-contained event, he suggested that part of its liquidity may have come from investors selling previous winners to fund the chase into chips.
That made sense at the time. Gold had lost momentum, Bitcoin had cooled and semiconductors appeared to offer the cleanest exposure to the AI buildout. Capital moved toward the brightest corner of the market, as it usually does when growth, momentum and narrative all point in the same direction.
But once the chip trade began to crack, the flow could work in reverse.
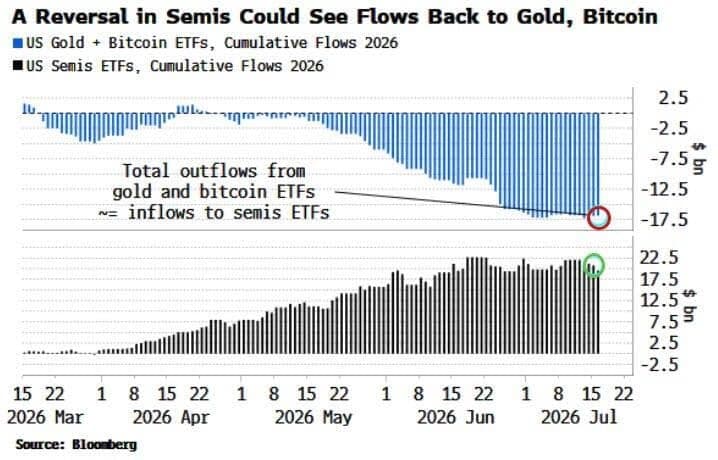
Investors who had sold gold to finance semiconductor exposure were suddenly holding a weakening asset while watching bullion begin to stabilize. That did not guarantee a direct round trip, but it created the conditions for at least part of the money to come back.
The important point is that gold’s rebound was not driven only by falling yields, geopolitical anxiety or a change in Fed expectations. It was also helped by the unwinding of an earlier liquidity shift that had moved capital out of macro hedges and into the narrowest part of the equity market.
Goldman’s work explained why gold was able to absorb that pressure without suffering a deeper structural break.
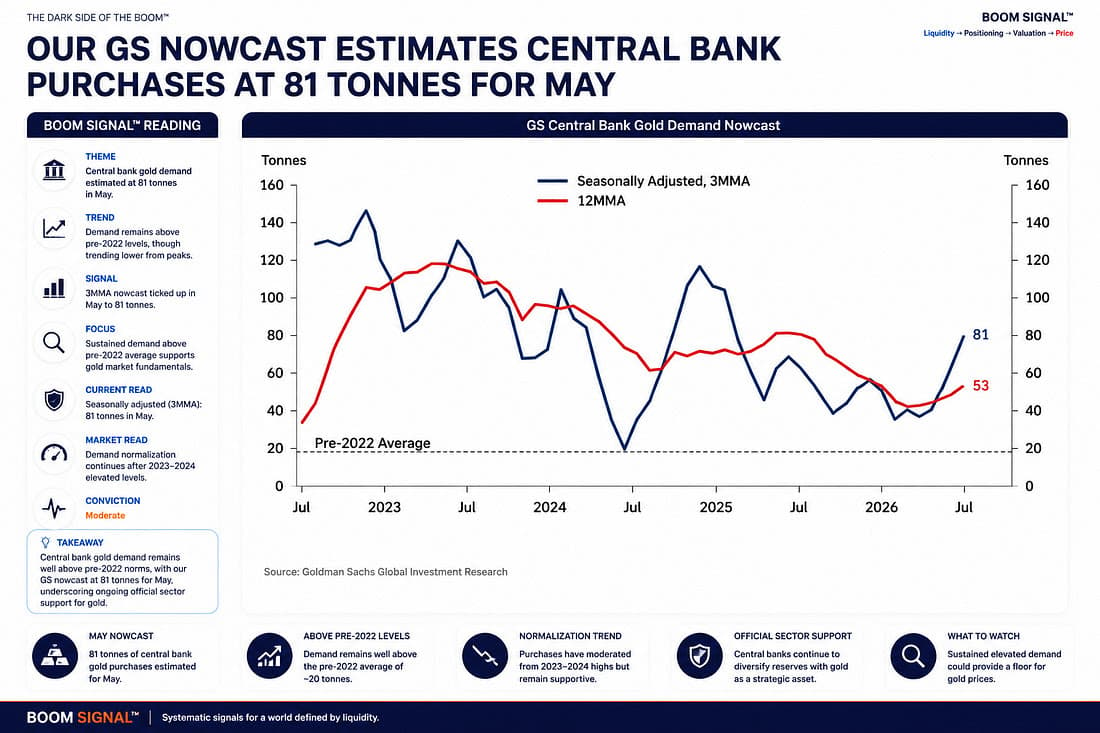
According to Goldman Sachs Global Investment Research, central banks purchased an estimated 81 tonnes of gold in May, with the three-month seasonally adjusted pace running at 67 tonnes per month, nearly four times the pre-2022 average. China was the largest identifiable buyer, reinforcing the view that official-sector demand remains part of a broader reserve-diversification process rather than a short-lived response to price weakness.
That distinction matters because central banks operate on a very different clock from ETF investors, macro funds and leveraged futures traders.
They are not trying to front-run the next inflation print or trade the next move in real yields. They are buying gold because the reserve system looks more politically exposed, more fragmented and more dependent on confidence than it once did.
The freezing of Russia’s reserves in 2022 changed the calculation. Reserve managers were reminded that foreign assets can carry political conditions as well as financial returns, and that diversification is no longer simply a matter of spreading risk across currencies. It is also about holding part of the national balance sheet outside another government’s reach.
Gold fits that requirement neatly. It carries no foreign issuer risk, no counterparty promise and, once held domestically, sits beyond much of the sanctions machinery that now shadows the reserve system.
That structural demand is the foundation beneath Goldman’s $4,900/oz end-2026 forecast. The target is attention-grabbing, but the more important issue for traders is how official buying changes the behaviour of corrections.
A stronger dollar and higher real yields can still push gold lower. ETF selling can still accelerate a pullback and leveraged positions can still be forced out. But the market now appears to have a large buyer underneath it that is far less sensitive to short-term price moves.
The Fed controls the weather. Central banks are positioning for the climate.
That is where the two earlier calls meet.
White identified a potential source of returning private capital as the semiconductor trade weakened. Goldman identified the patient official-sector demand already sitting below the market. One helped explain why money might come back into gold, while the other helped explain why the correction never fully lost its footing.
That made the rebound worth following.
Still, I would not overstate what the chart has accomplished.
Gold has moved from technically vulnerable to technically constructive. Momentum has improved, several minor resistance levels have been cleared and the market has shown that it can absorb renewed pressure from the dollar and rates without immediately falling apart.
But the major technical 200-day MA ceiling remains in place. ( $4,505–$4,510/oz)
Until that level gives way decisively, the move should still be treated as a recovery rather than a clean resumption of the broader bull trend. The market has climbed back onto the road, but it has not yet crossed the mountain pass.
For the next leg to become more convincing, gold will need stronger follow-through from price and broader support from flows. A break above the major resistance zone would be the first requirement. A more stable real-yield backdrop, a softer dollar and renewed ETF demand would add further weight.
Continued central-bank buying remains essential, but official demand alone may not be enough to drive a sustained acceleration. Central banks can provide the foundation; private investors usually build the next floor.
The semiconductor unwind may continue to help. If investors keep reducing crowded AI exposure, gold remains one of the more obvious places for capital to return, particularly because its investment case does not depend on another round of heroic capital expenditure, flawless earnings execution or permanently generous liquidity.
That does not mean every chip-market outflow will find its way into bullion. Markets are never that tidy. It simply means gold is once again competing for capital at a time when one of the market’s most crowded trades is losing its grip.
For now, the earlier calls look sound.
Simon White’s flow analysis helped identify why gold could benefit from a reversal in semiconductor leadership. Goldman’s central-bank work helped explain why the market retained a firm base beneath the selling.
Fortunately, I followed both.
The bounce has been real, the foundations have improved and the market deserves more respect than it did a week ago.
But the larger technical work remains unfinished.
Gold has found its feet.
It has not yet broken free.
Author

Stephen Innes
SPI Asset Management
With more than 25 years of experience, Stephen has a deep-seated knowledge of G10 and Asian currency markets as well as precious metal and oil markets.