Gold climbs as Dollar Weakens and Oil slumps on Hopes for US‑Iran deal
- Gold climbed about 1% early Monday, rising from roughly $4,500 to trade near $4,557 an ounce, as traders viewed the pullback as a buying opportunity. A brief spike toward $4,580 followed before momentum eased.
- The rally followed President Trump’s remark that U.S.-Iran talks were progressing “orderly and constructive,” suggesting tensions around the Strait of Hormuz may ease; the news sent oil tumbling more than 5%, easing fears of a prolonged energy shock.
- Lately gold has behaved less like a steady safe‑haven and more like a jittery intraday trader—swinging hundreds of dollars as investors react to war headlines, oil moves, inflation concerns and shifting central‑bank expectations.
- With Kevin Warsh sworn in as Fed chair Friday, policymakers face a tricky macro split: falling oil could cool inflation and eventually allow rate cuts, a tailwind for gold, which gains appeal when yields fall. While a prolonged Iran conflict that lifts energy costs would keep inflation sticky and force Warsh to keep rates high, raising the opportunity cost of holding non‑yielding bullion.
- Many global market including the U.S., Hong Kong, the U.K. and much of Europe are closed for holidays on Monday, thinning liquidity. With U.S. markets shut for Memorial Day, volumes were light, meaning large orders can move prices more sharply.

Spot gold rose 1.05% to $4,557.14/oz at 09:26 GMT, while June U.S. gold futures gained 0.81% to $4,559.70.
Gold is seen as an inflation hedge, but higher interest rates lift yield-bearing assets, and a stronger dollar makes bullion pricier for foreign buyers.
CME FedWatch:
Current Target Rate = 3.50 - 3.75
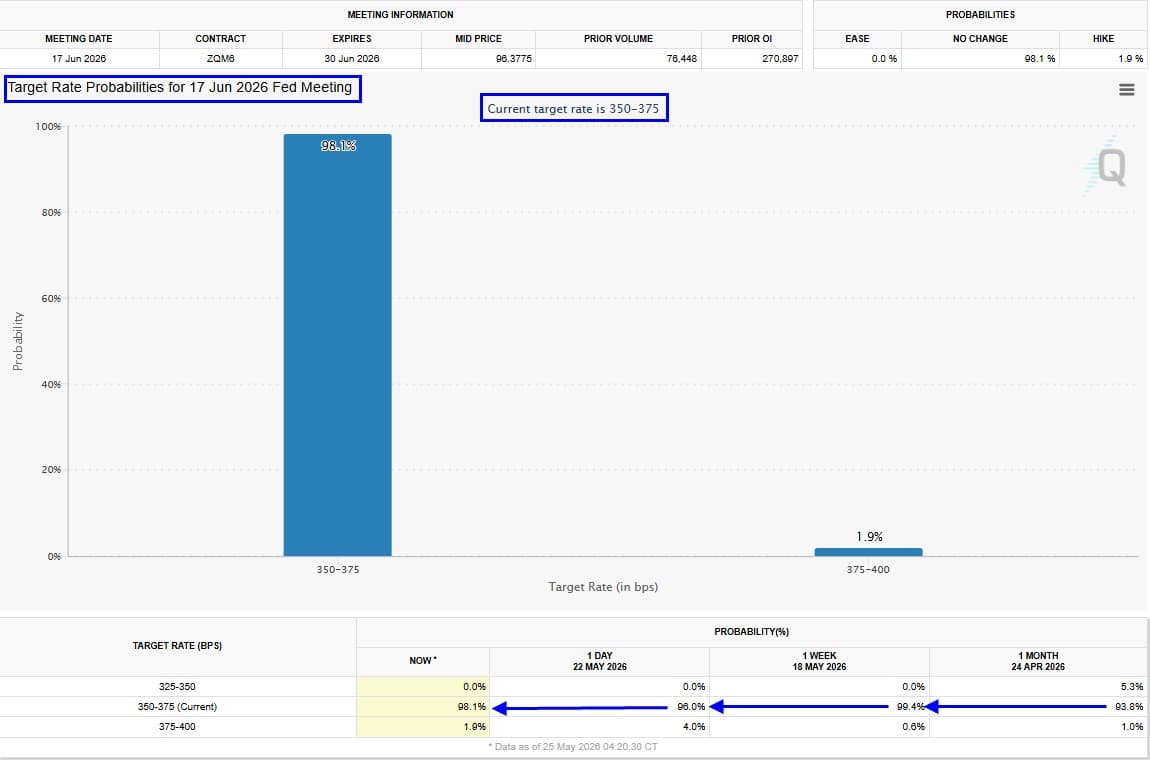
- CME FedWatch June no rate change probabilities have moved higher to 98.1% now from 93.8% on April 24, 2026.
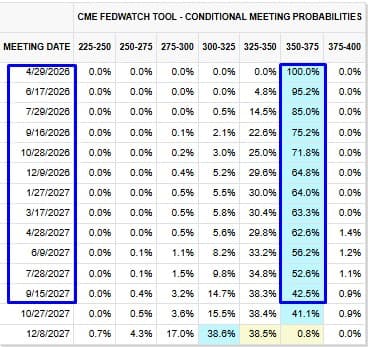
Fed rate probability
As of April 27, 2026
As of Today, May 25, 2026
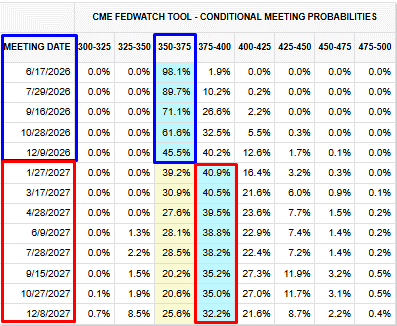
- CME FedWatch latest Fed rate probability points at no rate cut until end of 2026.
- Fed fund futures point at a likelihood of a rate hike in 2027.
Technical Analysis Perspective:
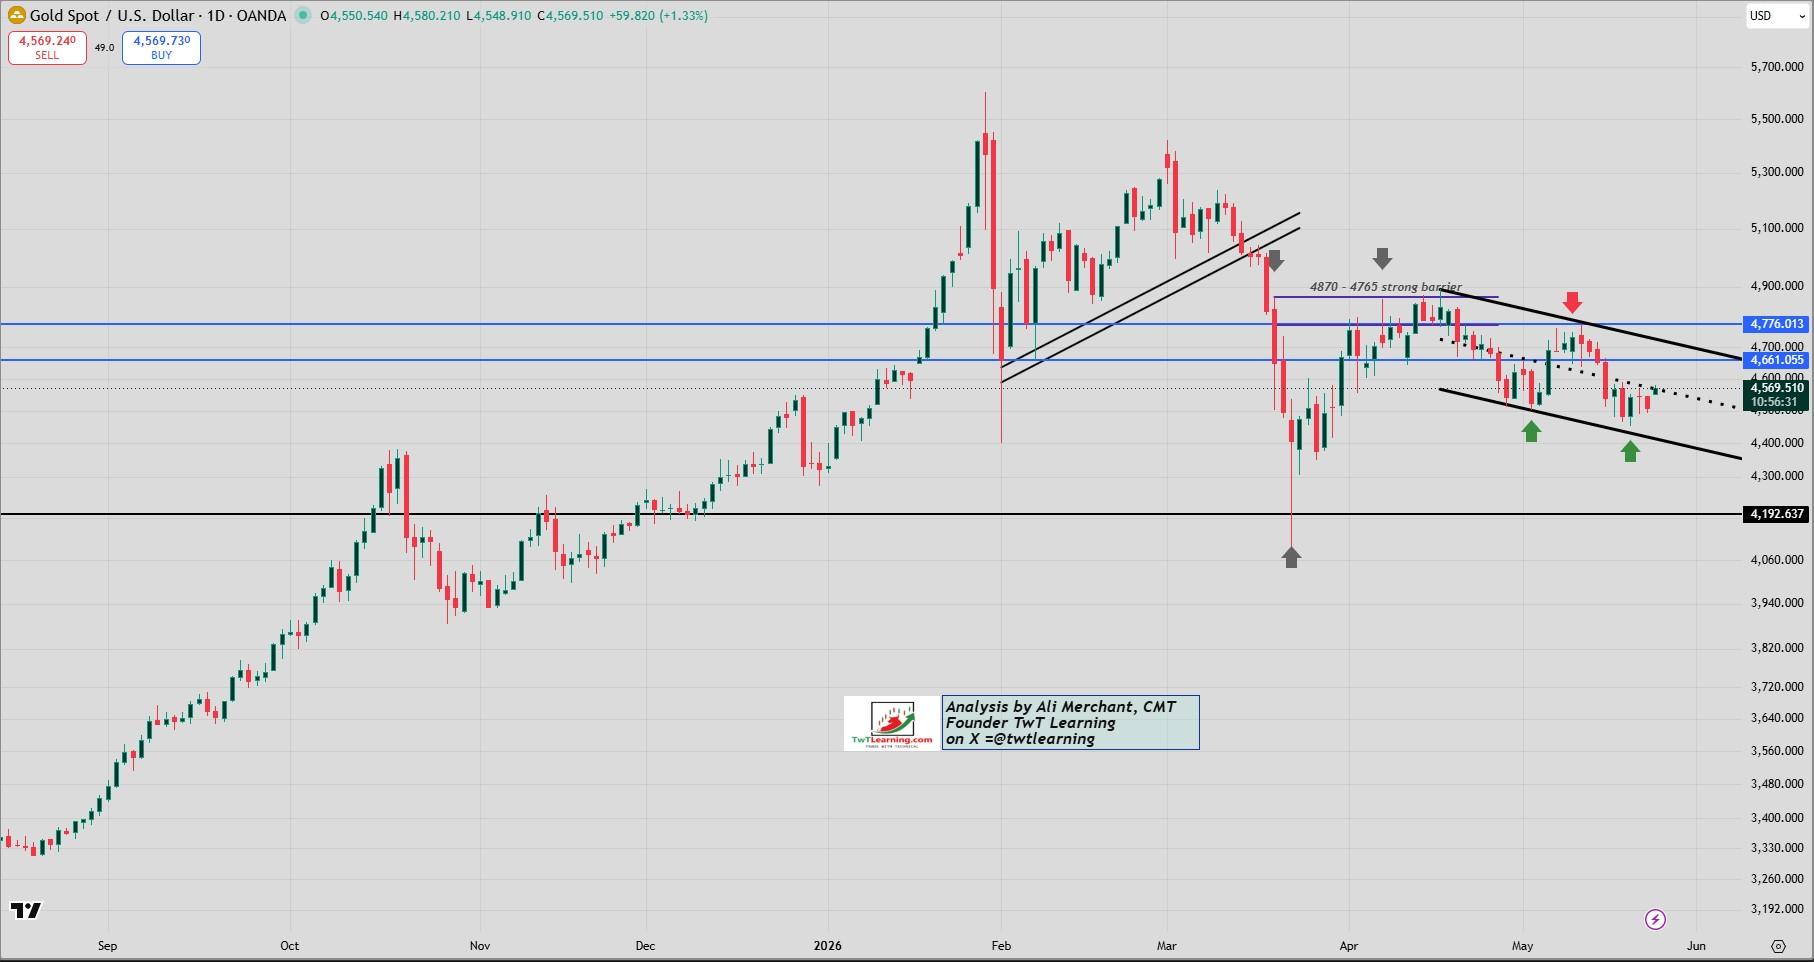
Gold/US Dollar:
- Spot gold is trading inside a declining channel pattern facing the mid-line obstacle at 4,575 – 4580.
- A solid rise above 4,580 would pave the way for additional rally to 4,660 – 4,665.
- Failure to penetrate the above obstacle would target 4,500 -4495 support zone.
Gold daily chart:
Gold/Silver Ratio:
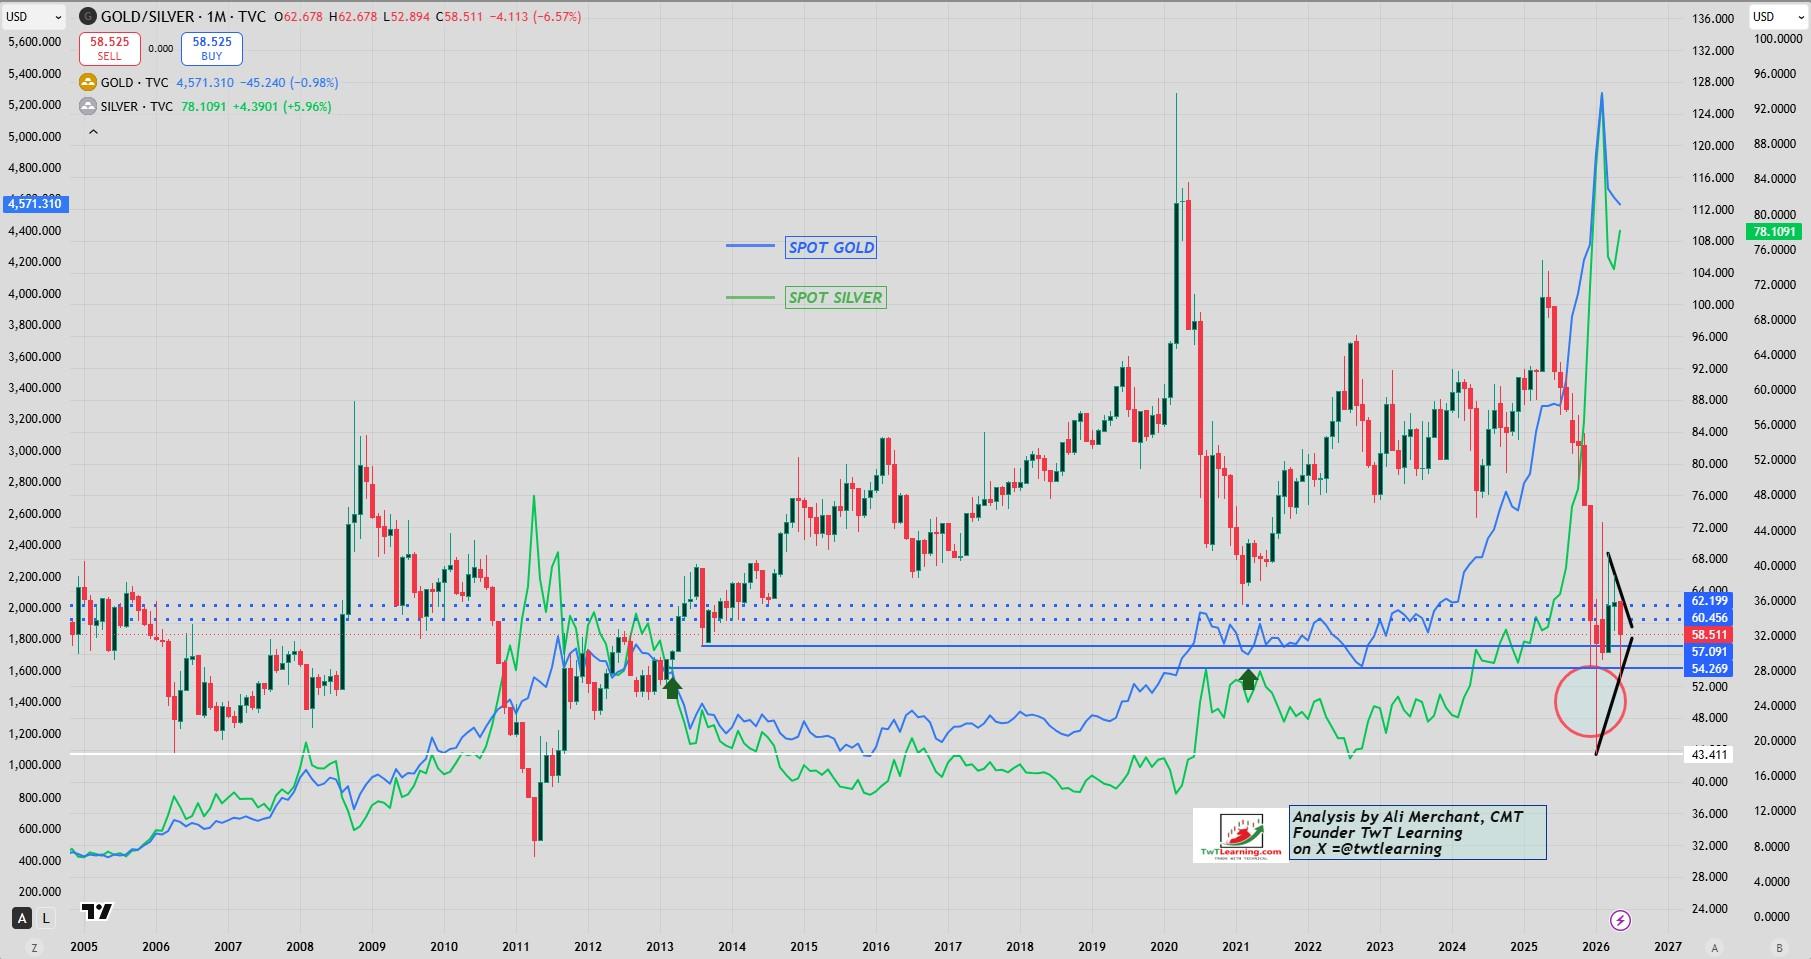
- The gold–silver ratio measures how many ounces of silver buy one ounce of gold (gold ÷ silver), a key relative-value metric.
- The ratio is facing an obstacle around 65% with a strong support around 54% in May.
A rising ratio typically indicates relative weakness in silver versus gold.
Gold/Silver Ratio:
- The gold–silver ratio measures how many ounces of silver buy one ounce of gold (gold ÷ silver), a key relative-value metric.
- The ratio is facing an obstacle around 65% with a strong support around 54% in May.
A rising ratio typically indicates relative weakness in silver versus gold.
Gold/Silver Ratio Monthly chart:
Author

Ali Merchant, CMT
TwT Learning
Ali Merchant is a seasoned financial market professional with expertise in Technical Analysis, Treasury & Capital Markets, Trading, Sales, Research, Training, & Fund Management, He has been trading FX, FX options, US stocks & opti