Gold and the Dollar both down after inflation

After 10 June’s American inflation releases mostly met the consensus, unusually both gold and the US dollar in most of its pairs declined. Traders also concentrated on renewed hostilities between the USA and Iran in recent days. The probability of at least a single hike by the Federal Reserve (the Fed) in December remains similar to earlier this week for now. This article summarises the American data on inflation and recent news then looks briefly at the charts of XAUUSD and GBPUSD.
After an overall very positive NFP on 5 June, there had been a fairly high probability that inflation might be higher also. This was correct as the annual headline figure met the consensus of 4.2%.
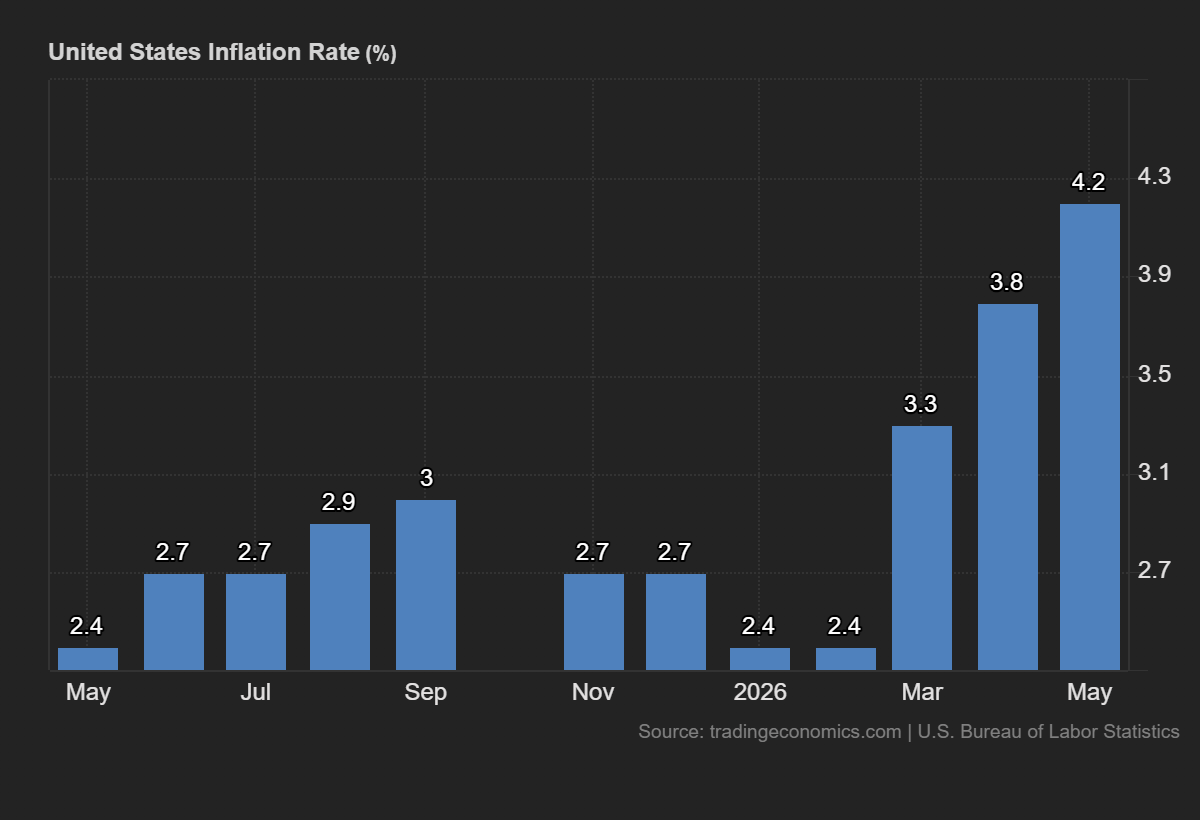
4.2% is the highest annual headline inflation in the USA since April 2023, largely reflecting much higher costs of energy amid the ongoing conflict in the Gulf. The rate of increase in average prices for fuel accelerated significantly and there was also evidence of knock-on effects on the price of food.
However, in the context, this rate of inflation isn’t unexpected. The monthly core figure was actually slightly lower than the consensus. The probability of at least one hike by the Fed by the meeting in December is around 65% according to CME FedWatch, similar to what it was at the start of the week. Rates in the USA remain relatively restrictive although the Fed does seem to have room to hike given recently much stronger job data on average. However, GDP for Q1 has been weaker than expected according to the first two estimates.
The USA and Iran aren’t clearly closer to peace in recent days; on the contrary, recent attacks seem likely to set negotiations back. Neither side seems to have the appetite for a full resumption of the conflict and abandonment of talks, but a final peace deal within the next few days seems very unlikely for now.
Gold likely to retest $4,100
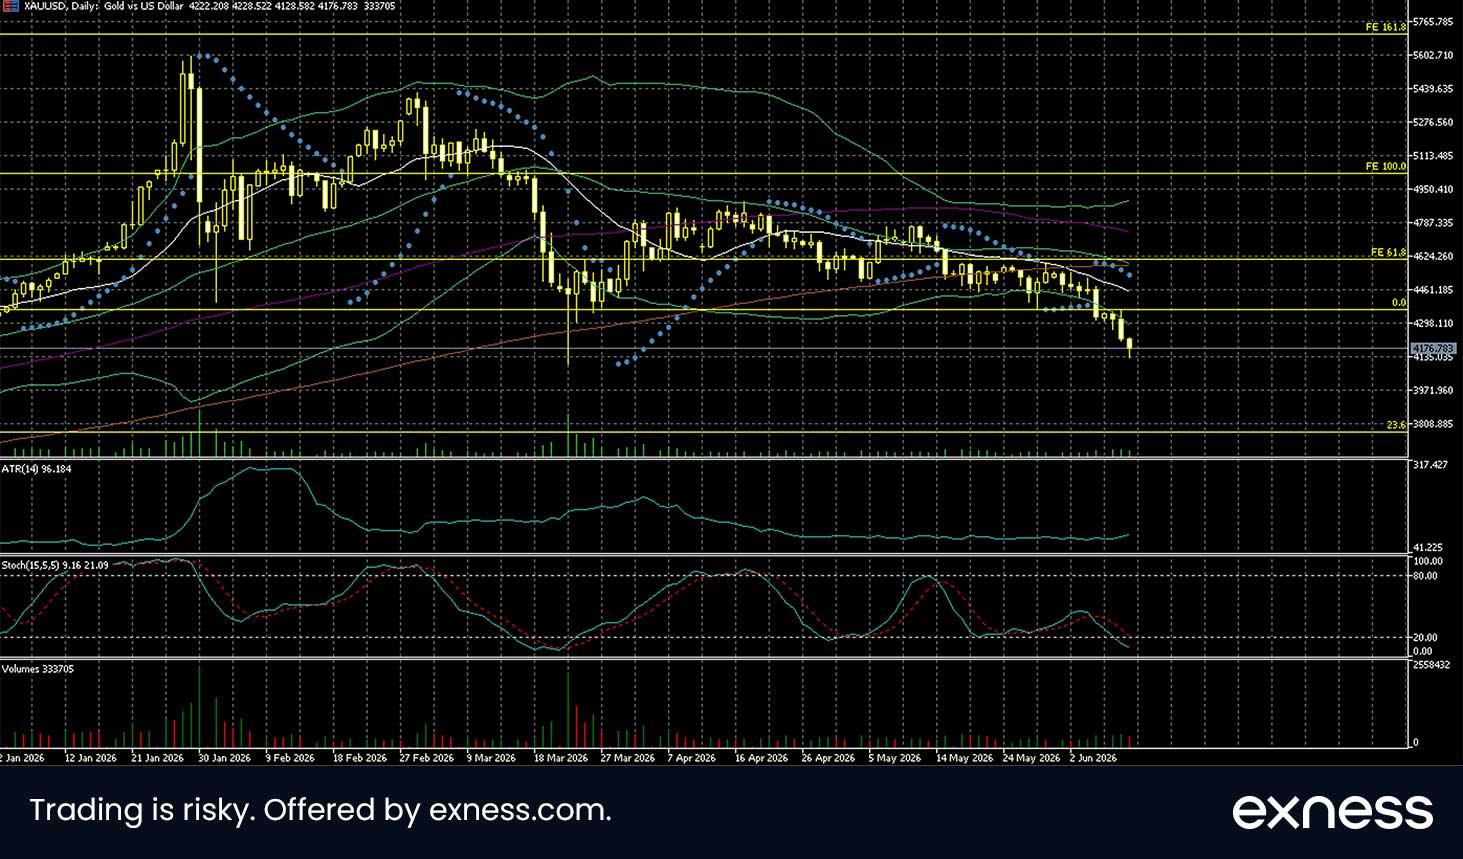
Gold posted a slight overall decline in the aftermath of American inflation meeting the consensus except for the monthly core figure. Sentiment has been mostly negative as the Fed still seems likely to hike at the end of the year and tit-for-tit strikes in the Gulf called an imminent agreement into serious question. 9 June’s close around $4,220 saw all of 2026’s gains erased and the price return to areas familiar from late November 2025.
$4,100 and $4,000 might both be important supports with reference to the long tail on 23 March. Given relatively low daily volatility and strong oversold conditions, it’s questionable whether the price will push much lower immediately; a bounce seems possible sooner or later. The value area between the 20 and 50 SMAs around $4,500 is likely to cap any gains in the near future.
The possibility of a bounce might be more favourable if confirmed by clear technical signals such as an upward engulfing pattern and an upward crossover of the stochastic in oversold. However, it’d be possible for the price to consolidate ahead of the Fed’s meeting on 17 June. Traders are likely to continue monitoring news from the Gulf; a lull in the next few days and renewed hopes of a firm agreement might boost gold.
Cable gains as traders weigh the outlook for monetary policy
With lower inflation than expected in Britain in May, the probability of the Bank of England hiking before September has declined although a single hike seems priced in for 17 September. Meanwhile despite rising inflation in the USA the Fed is still only moderately likely to hike in December with a probability of around 65% at the time of writing. New developments in British politics depend heavily on the results of 18 June’s byelection in Makerfield near Wigan which might significantly destabilise the government if the ruling Labour party is unseated there.
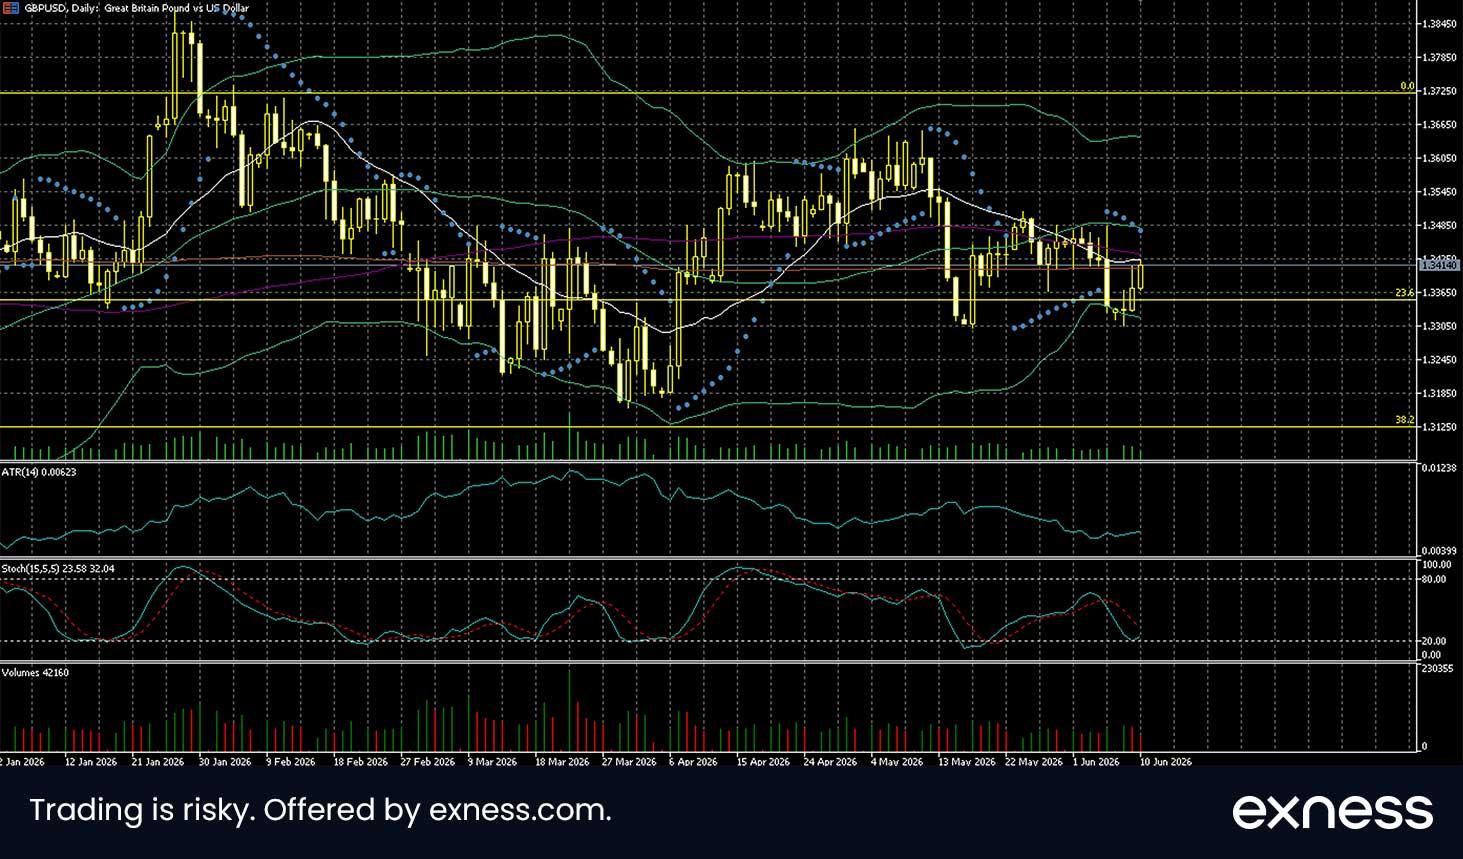
The test of $1.34 was still ongoing in the hours after American inflation on 10 June but even if successful the price might meet dynamic resistance from the various moving averages not far above. The slow stochastic on the daily chart remains close to oversold. $1.35 seems like a clear candidate for resistance which might cap gains barring a major new fundamental narrative.
$1.33 is the area of a double bottom from mid May and 8 June somewhat below the 23.6% weekly Fibonacci retracement. A break below there is questionable in the near future unless 12 June’s British monthly GDP is notably worse than expected. 17-18 June are particularly important for cable with both relevant central banks meeting on consecutive days, possibly giving hints on the timing of hikes later in the year.
Author

Michael Stark
Exness
Michael has been investing since 2007 and trading CFDs since 2013. He favors considering both fundamental and technical analysis where possible, with a focus on swing and position trading.
















