GBP/USD Weekly Forecast: Sterling at the crossroads of breaking higher in data busy week

Sterling marked a winning streak of five trading days in a row against the US Dollar during the second week of April appreciating towards 2018 high as the interest rate outlook and hope for a trade deal with the EU next week played a key role. The GBP/USD opened the week on a stronger footing at 1.4090 and rose all the way up to 1.4297 on Friday as the Bank of England Monetary Policy Committee member Ian McCafferty said at the beginning of last week that the Bank should not delay hiking interest rates again due to a possibility of faster pay rises. McCafferty’s comments were aired about the month ahead of the crucial May MPC meeting that is pondered to deliver another rate hike. In support for Sterling was dissipating fear of the US-led trade wars with China.
With trade war factor losing steam and both the US and China decided to work the trade disputes out in more diplomatic way, the risk-on mood ruled the market with exception of the geopolitical risk re-emerging in tweets from the US President Trump threatening Syria with military intervention against Russia-supported President Assad suspicious of poison attacks against rebels and civilians in civil-war stricken country.
Fundamentally, there was no reason to cheer Sterling with the UK manufacturing output missing the expectation falling 0.2% over the month in February while the index of industrial production rose mere 0.1% over the month supported mainly by recovery in mining and quarrying after the shutdown of the Forties oil pipeline in December 2017. Both manufacturing output and a broader measure of industrial production in the UK increased when compared to a year ago rising 2,55 y/y and 1,95 y/y respectively.
At the other side of the Atlantic, the US inflation in March together with the Federal Reserve Bank’s March meeting minutes headlined the second week of April. While US inflation data met the market expectation with core inflation accelerating to 2.1% y/y in March from 1.8% y/y in February markets seeking clues for justifying the March interest rate hike in the FOMC minutes felt a bit disappointed as Fed policymakers did not hold a convincing hawkish stance and the US Dollar losing on the news.
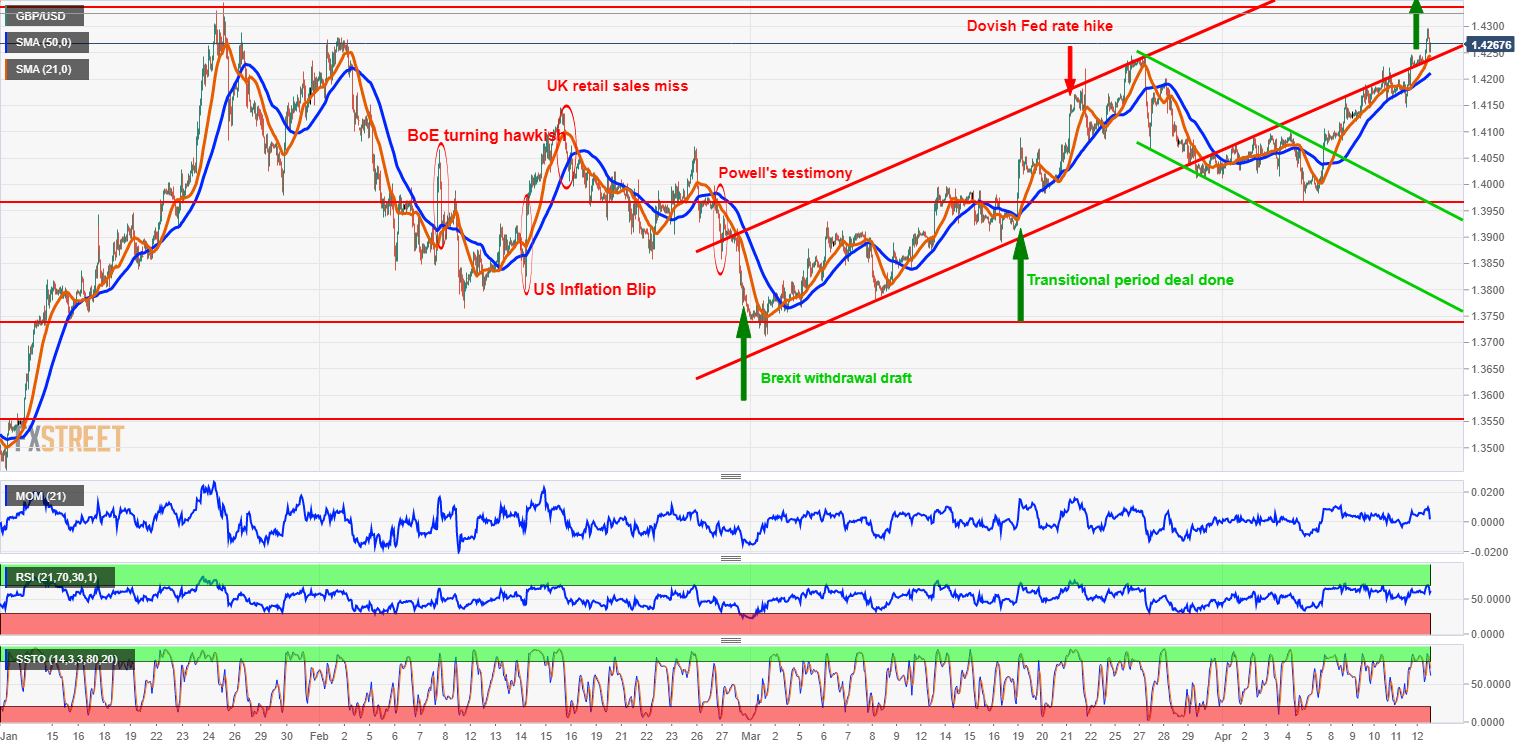
Technically, the GBP/USD rose to the highest level since January 25 this year and returned back to the upward trending channel that has begun on March 1 this year after the UK reached a Brexit withdrawal deal with European Union with the negotiating period being extended to December 2020.
With GBP/USD correcting lower from the cyclical high of 1,4297 on Friday, short-term technical oscillators like Momentum and the Relative Strength Index (RSI) turned lower on 1-hour chart and the Slow Stochastics also made a bearish crossover just below the oversold territory. The fundamental push for Sterling higher is supported by the interest rate outlook presented earlier this week by the Bank of England Monetary Policy Committee member Ian McCafferty and after the pair breaks 1.4300 psychological level the next target is the cyclical high of 1.4345.
GBP/USD 1-hour chart
Technical analysis
GBP/USD weekly chart
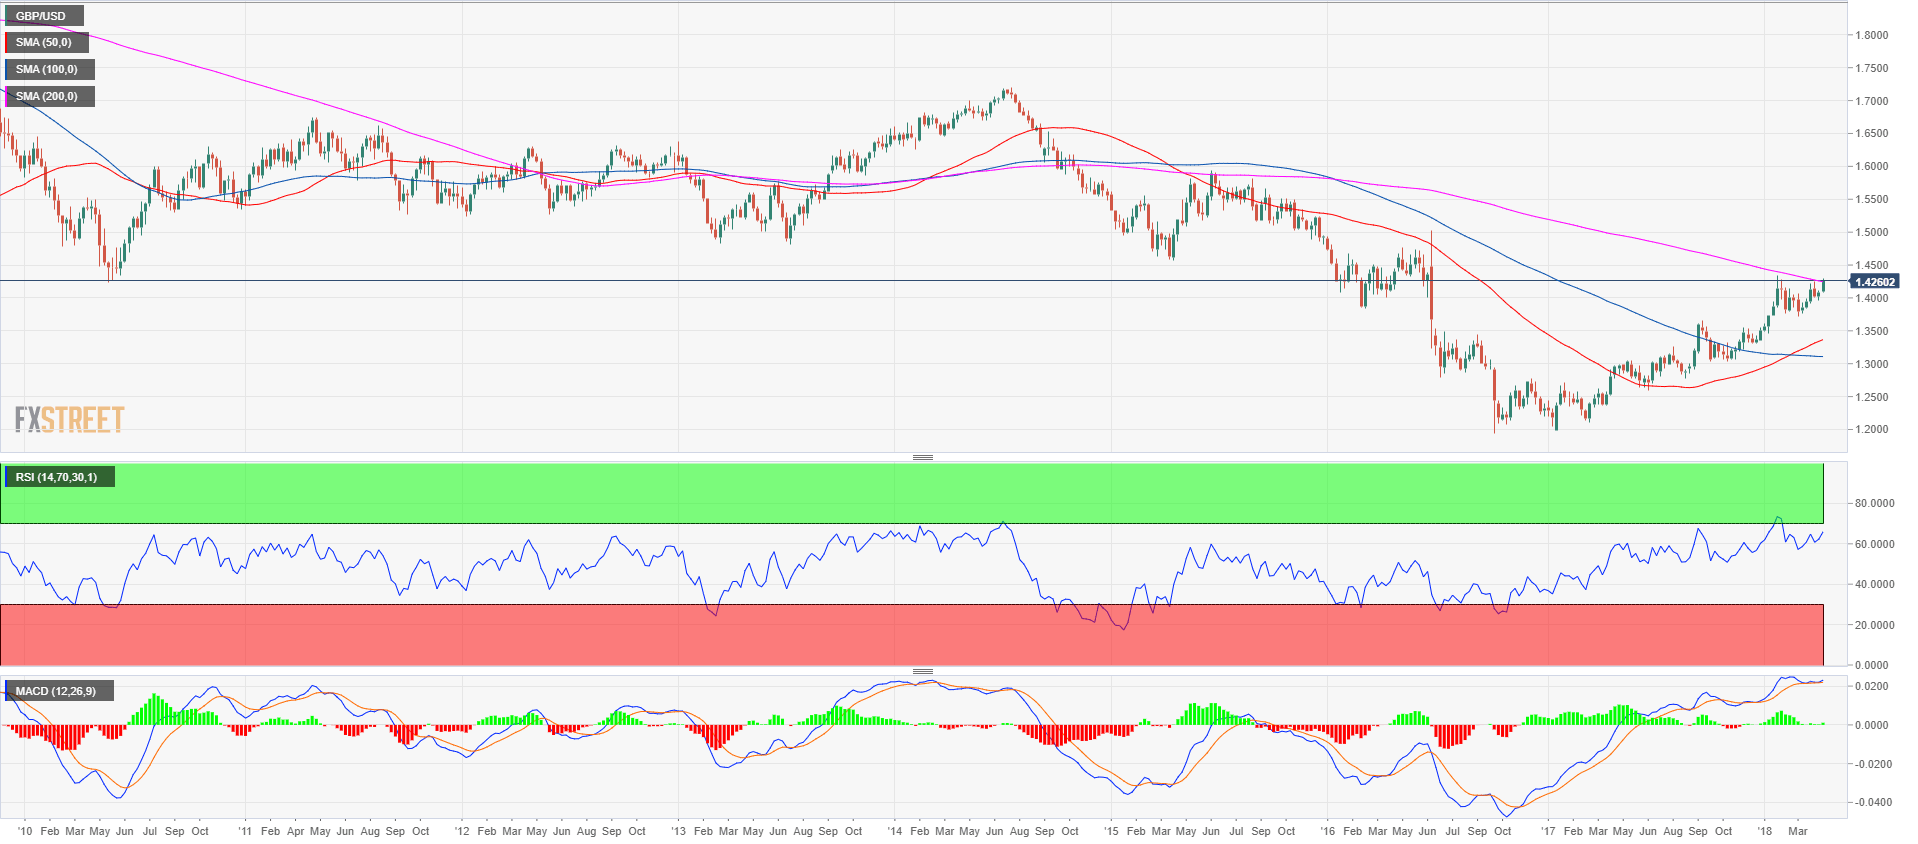
The GBP/USD on the weekly chart is trading in a bull channel since July 2016. The GBP/USD currency pair is currently testing an important resistance level at the 1.4245 level which is the 200-period simple moving average on the weekly time frame. If the buyers are able to break above the resistance the next hurdle to overcome will be the 1.4346 level which is the 2018 high from January 25. If the 1.4245-1.4346 resistance zone is broken to the upside, the market will set its eyes on the 1.4500 figure level and 1.5000 swing high and important psychological level. On the other hand, if the market is unable to break the 1.4245-1.4346 resistance zone, the sellers can take the lead and bring the market back to the 1.4000 psychological level and then to 1.3711 swing low.
GBP/USD daily chart
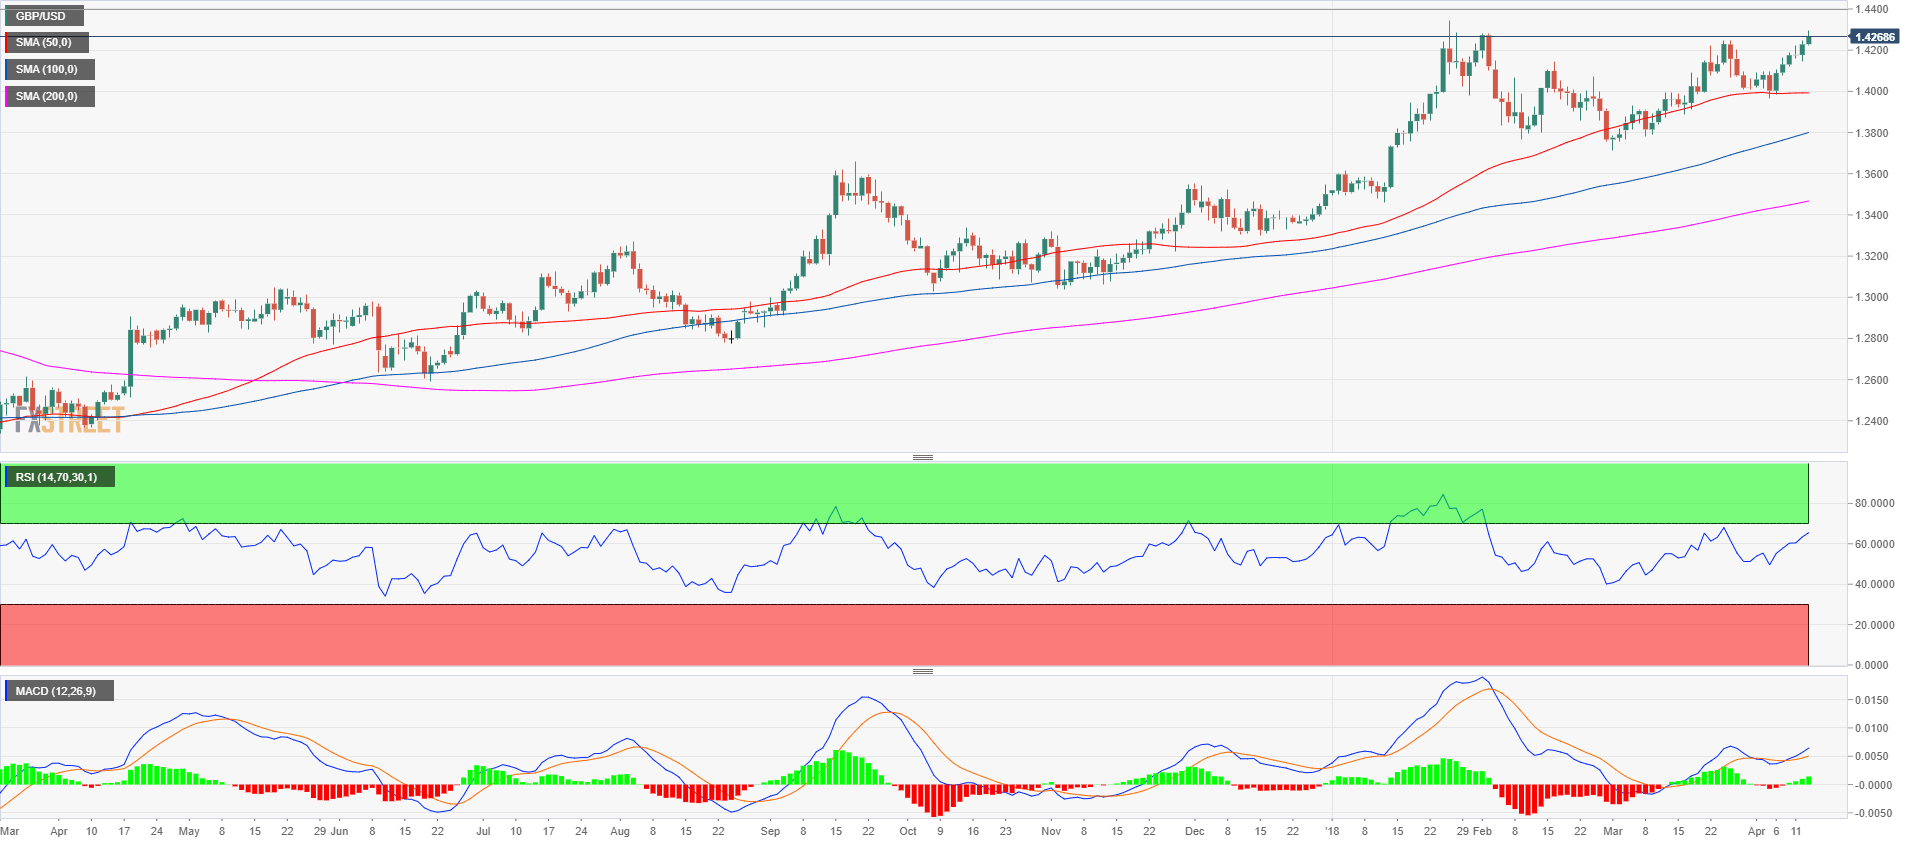
The market is trading up in a tight bull channel since April 6 after it found support at the 50-period simple moving average on the daily time frame. On Friday, April 14, the bulls broke above 1.4245 swing high made on March 27 and above 1.4279 swing high made on February 2. The last checkpoint that bulls need to overcome is the 2018 high which is at 1.4346. The GBP/USD is at a key level and all eyes are on the 1.4245-1.4346 resistance zone as discussed on the weekly chart analysis. A rejection of the current level should find initial support at 1.4145 which is the April 12 low, followed by a retest of the 1.3965 swing low made on April 5. The Relative Strength Index indicator (RSI) is in positive territories but is not yet confirming the new high above the previous swing at 1.4245. The Moving Average Convergence/Divergence (MACD) indicator is indicating a bullish momentum.
GBP/USD 4-hour chart
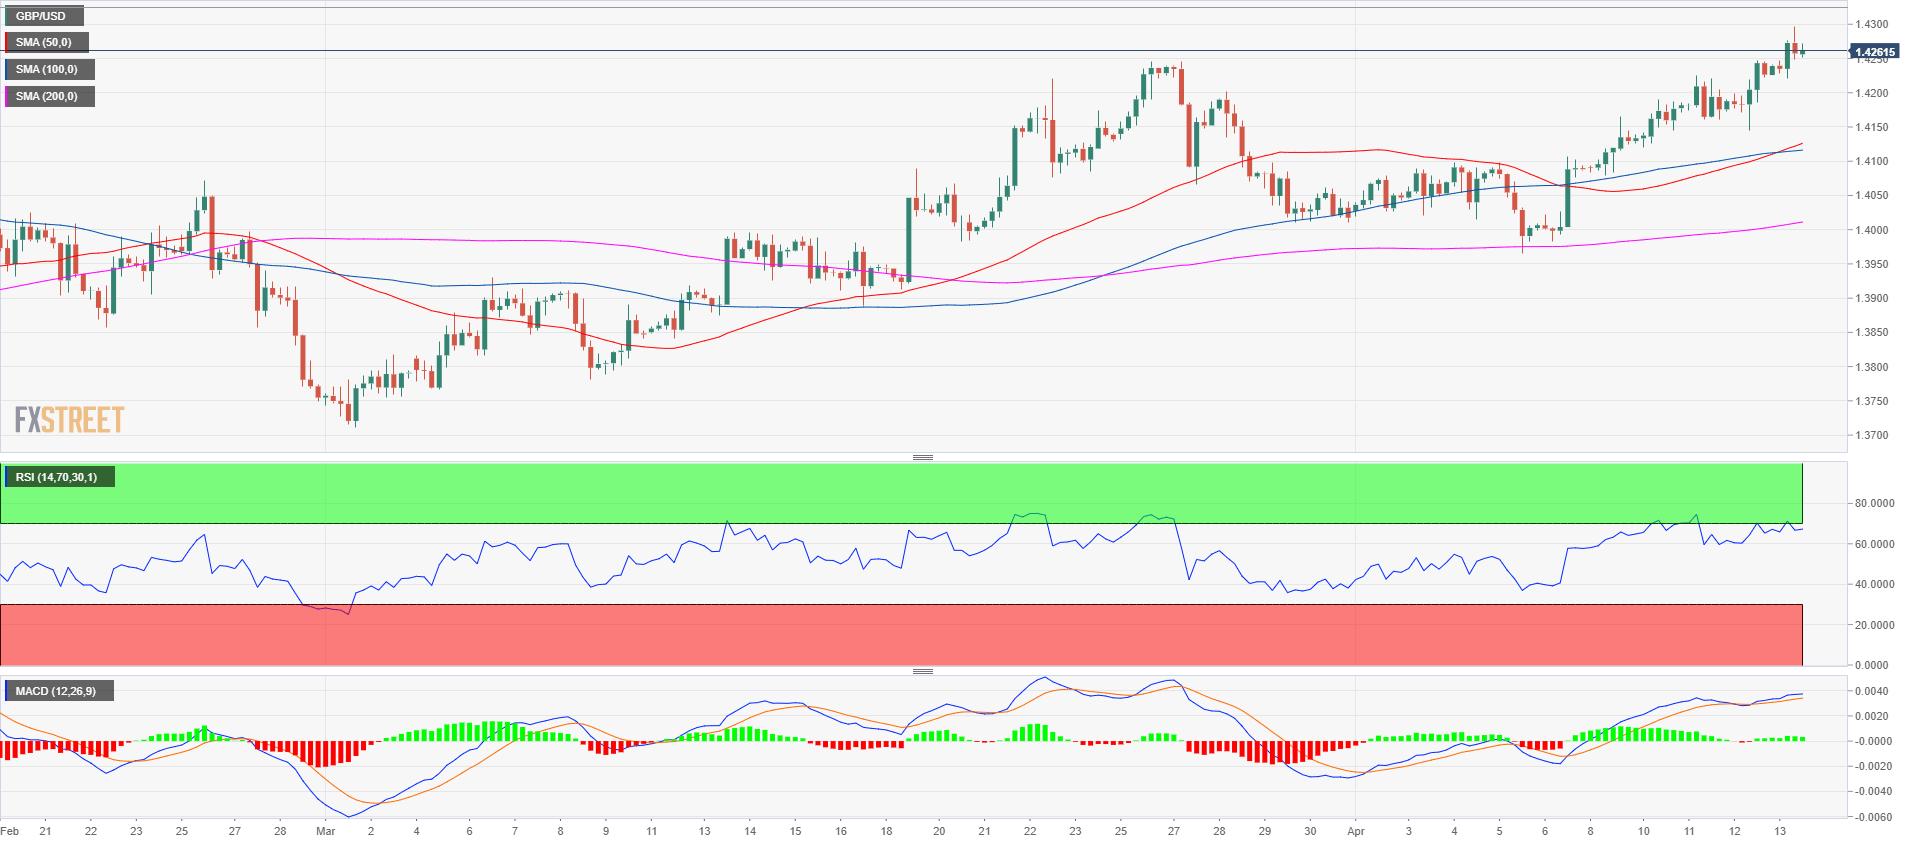
The market rejected the 1.4300 resistance level an traded as high as 1.4297 in Friday’s trading. However, the current bull momentum is strong and the bears were unable to generate any convincing counter-trend move down up to this point. A failure to move beyond the 1.4245-1.4346 resistance zone could lead to a pullback to the 1.4145 swing low and 1.41 psychological level in the short-term. A break above the 1.4245-1.4346 zone can lead to an acceleration towards the 1.4500 psychological level.
Upcoming macro data
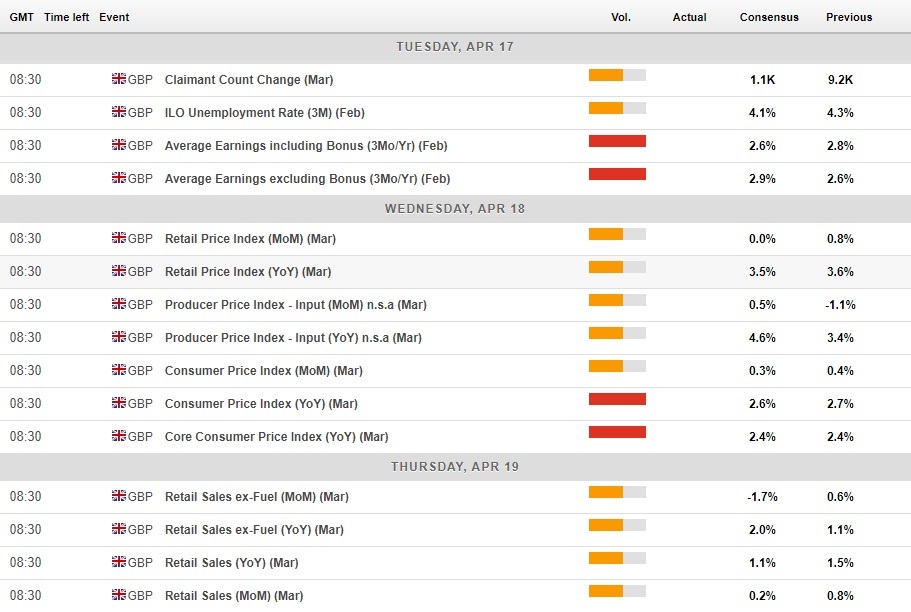
The UK economic calendar for the third week is very strong with all of the important macroeconomic indicators concentrating to three trading days of next week. The UK inflation, labor market, and retail sales data are all due from Tuesday to Thursday next week indicating the need for the Bank of England to raise rates sooner rather than later with wage growth picking up in the tightest UK labor market in more than 4 decades.
The macro calendar kicks off with the UK labor market report for March where the average weekly earning is probably the most closely watched indicator. The average weekly earnings excluding bonuses are expected to rise 2.9% y/y in three months ending in February, rising faster than inflation for the first time since January 2017 when inflation reached 1.8% y/y while wages rose 2.2% y/y. The unemployment rate is expected to fall to another multi-decade low of 4.1% in three months to February while claimant count is seen increasing 1.1K in March.
The UK inflation is due next Wednesday and it is expected to decelerate further in March to 2.6% y/y with core inflation adjusted for prices of food and energy rising 2.4% in March, unchanged from February. With inflation decelerating from December peak of 3.0% and wages rising, the end of the period of negative real wages is set to end soon, which is good news for UK shoppers. That is particularly evident in the UK retail sales that unexpectedly fell lower in January and rose only 0.1% m/m in February this year while they are expected to fall 1.7% m/m again when auto fuel is discounted.
The UK economic calendar for April 16-20
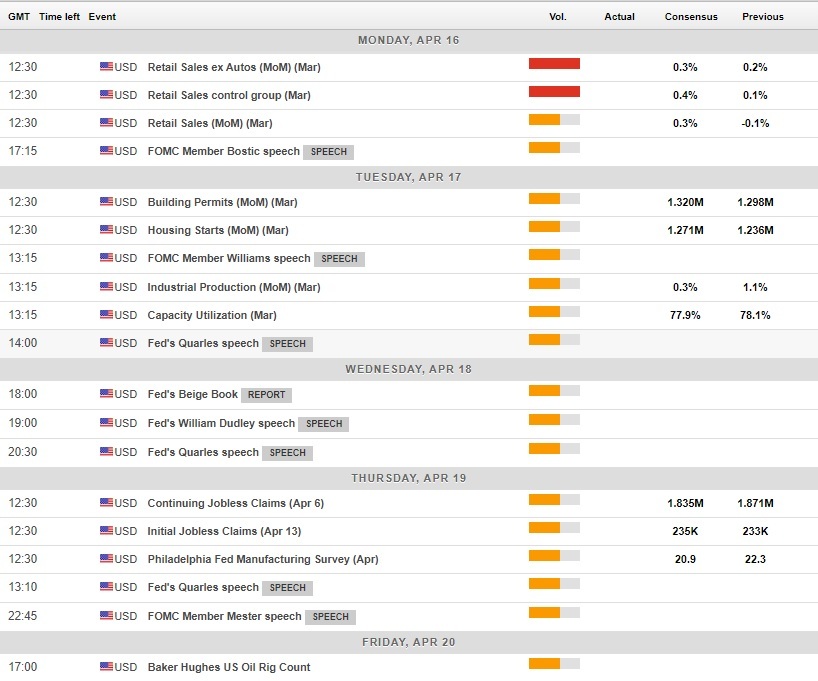
In the US the third week of April will be headlined by the US retail sales report for March, while housing starts and building permits and a whole set of Fed speakers are scheduled for the week ahead.
The US retail sales are expected to increase 0.3% m/m in March while the part of the retail sales called control group, that is included in the GDP is seen rising 0.4% m/m. In terms of the US labor market, weekly initial jobless claims are seen rising 235K during the week ending April 13.
Speeches from the Federal Reserve Bank official will include Atlanta Federal Reserve Bank President Raphael Bostic, San Francisco Federal Reserve Bank President John Williams, the New York Federal Reserve Bank President William Dudley, Chicago Federal Reserve Bank President Charles Evans, Cleveland Federal Reserve Bank President Loretta Mester and the Federal Reserve Governors Randal Quarles.
The US economic calendar for April 16-20
Forecast for next week
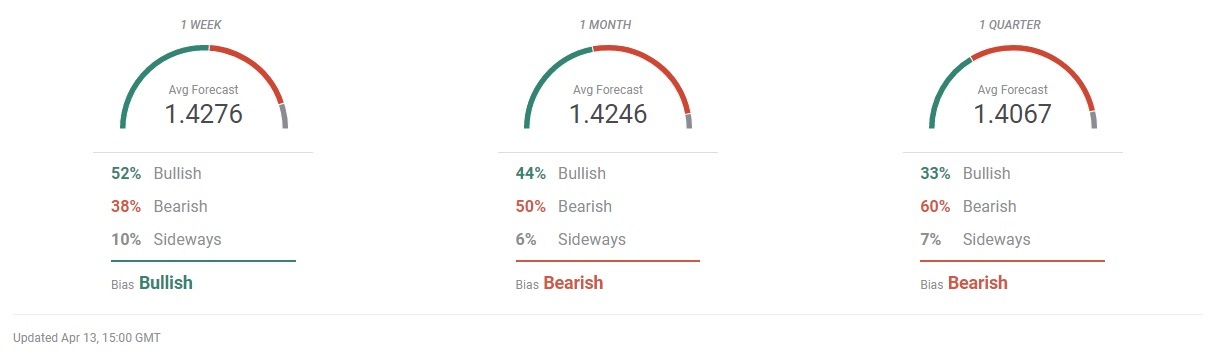
Analysts and economists participating in FXStreet Forecast Poll turned overly bearish once again last week for GBP/USD with the median prediction for last week at 1.3989, about 300 pips lower from current spot value. That means the median forecast was absolutely wrong in predicting the direction of the market. For the week ahead, the FXStreet Forecast Poll is short-term bullish but mid-term bearish.
Bets in the latest FXStreet Forecast Poll saw 52% of participants in the FXStreet Forecast Poll predict the bullish trend in one week time from now, but with the median of 1,4276 that is very close to current spot rate at the time of writing this report. Therefore the trend is rather neutral-to-sideways in short-run.
Unlike Forecast for EUR/USD, the GBP/USD Forecast for 1-month and 3-months from now are more varied. Although 1-month prediction of 1,4246 is also too close to the current spot, in 3-months time participating forecaster see GBP/USD lower at 1,4067 which is more distributed to the downside.
FXStreet Forecast Poll
Author

Mario Blascak, PhD
Independent Analyst
Dr. Mário Blaščák worked in professional finance and banking for 15 years before moving to journalism. While working for Austrian and German banks, he specialized in covering markets and macroeconomics.


