GBP/USD: Cable’s two-timeframe problem

A Prime Minister resigning should be a one-day headline. The more interesting question is why the chart was already leaning this way before the news crossed.
GBP/USD trades at 1.3235 as Westminster digests Keir Starmer’s resignation, with nominations for a successor opening on 9 July. The political risk premium is real, but it is landing on a pair that had no technical reason to be bid. That is the part worth slowing down on.
The daily: A channel doing its job
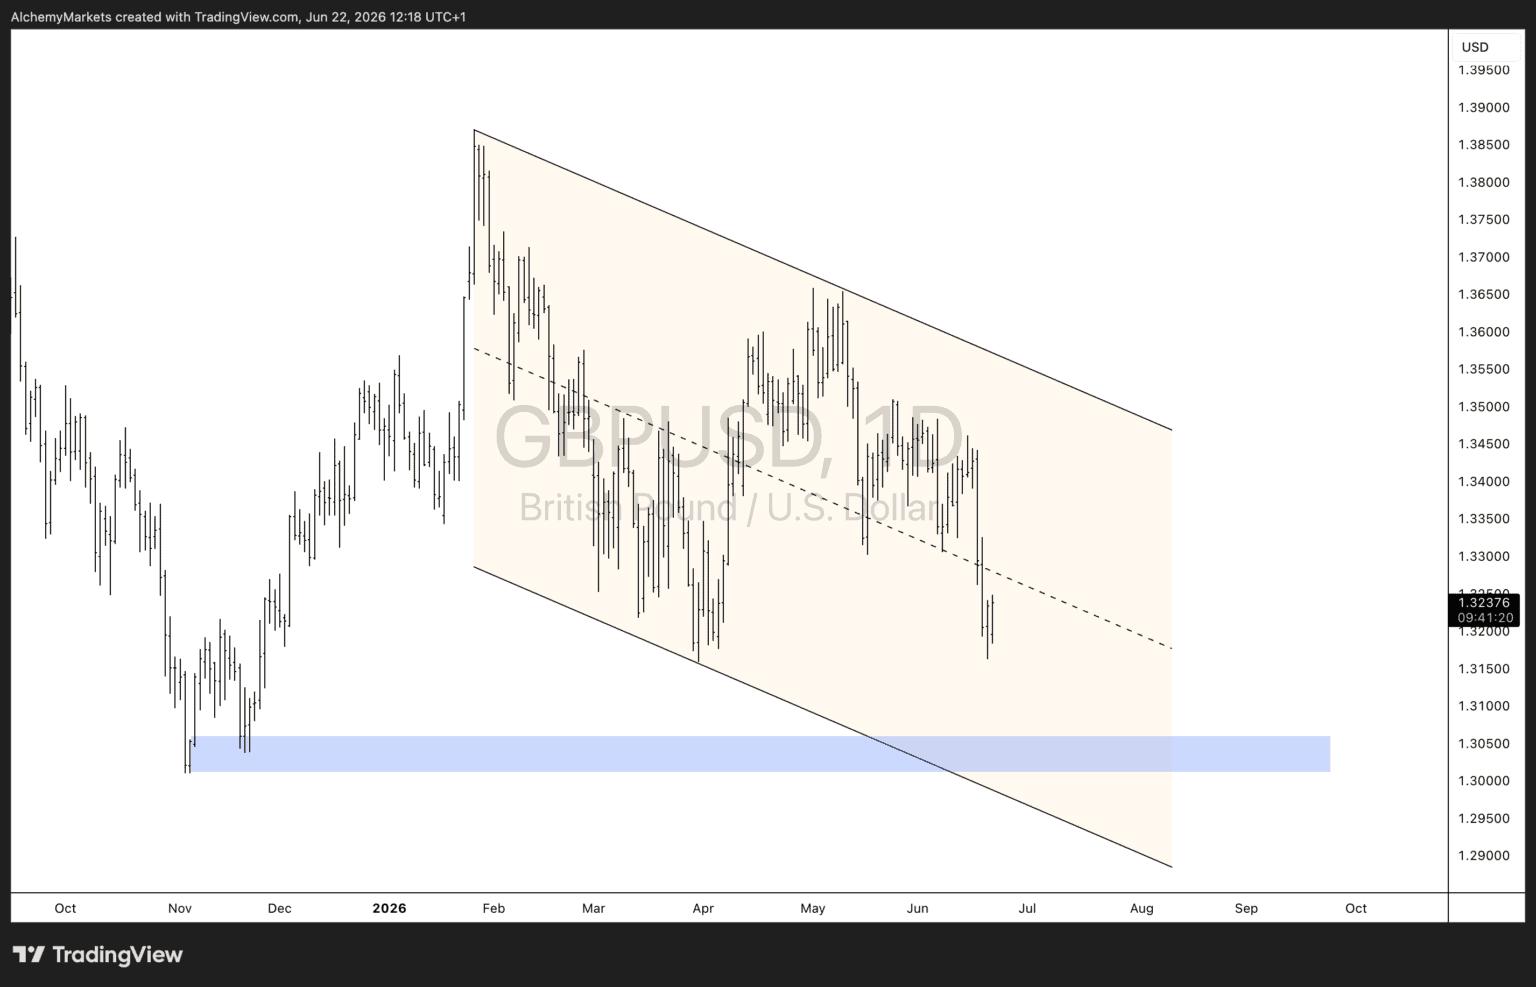
Step back to the daily and the move stops looking like a reaction and starts looking like a continuation. Cable has spent the entire year inside a clean descending channel anchored to the early-February high near 1.3870. Every rally into the upper boundary has been sold, every push toward the mid-line has faded. The May attempt to break character topped out around 1.3660 and rolled straight back over.
Price now sits in the lower half of that structure, below the dashed mid-line, with nothing meaningful between current levels and the channel floor. The feature that matters is lower down: a horizontal demand zone around 1.3030 to 1.3060, the shelf that held the November lows. The descending channel base is sliding down to meet that zone over the coming weeks, which stacks two independent floors into one region rather than two separate tests.
The macro backdrop is not helping the pound find a bid either. The dollar is trading near one-year highs after Warsh’s first FOMC, with markets now pricing roughly a 58% chance of at least two Fed hikes this year, up from 17% a week ago. A hawkish dollar and a leaderless UK government is a one-sided setup, and the daily channel has been telling that story since February.
The hourly: Where the trigger lives
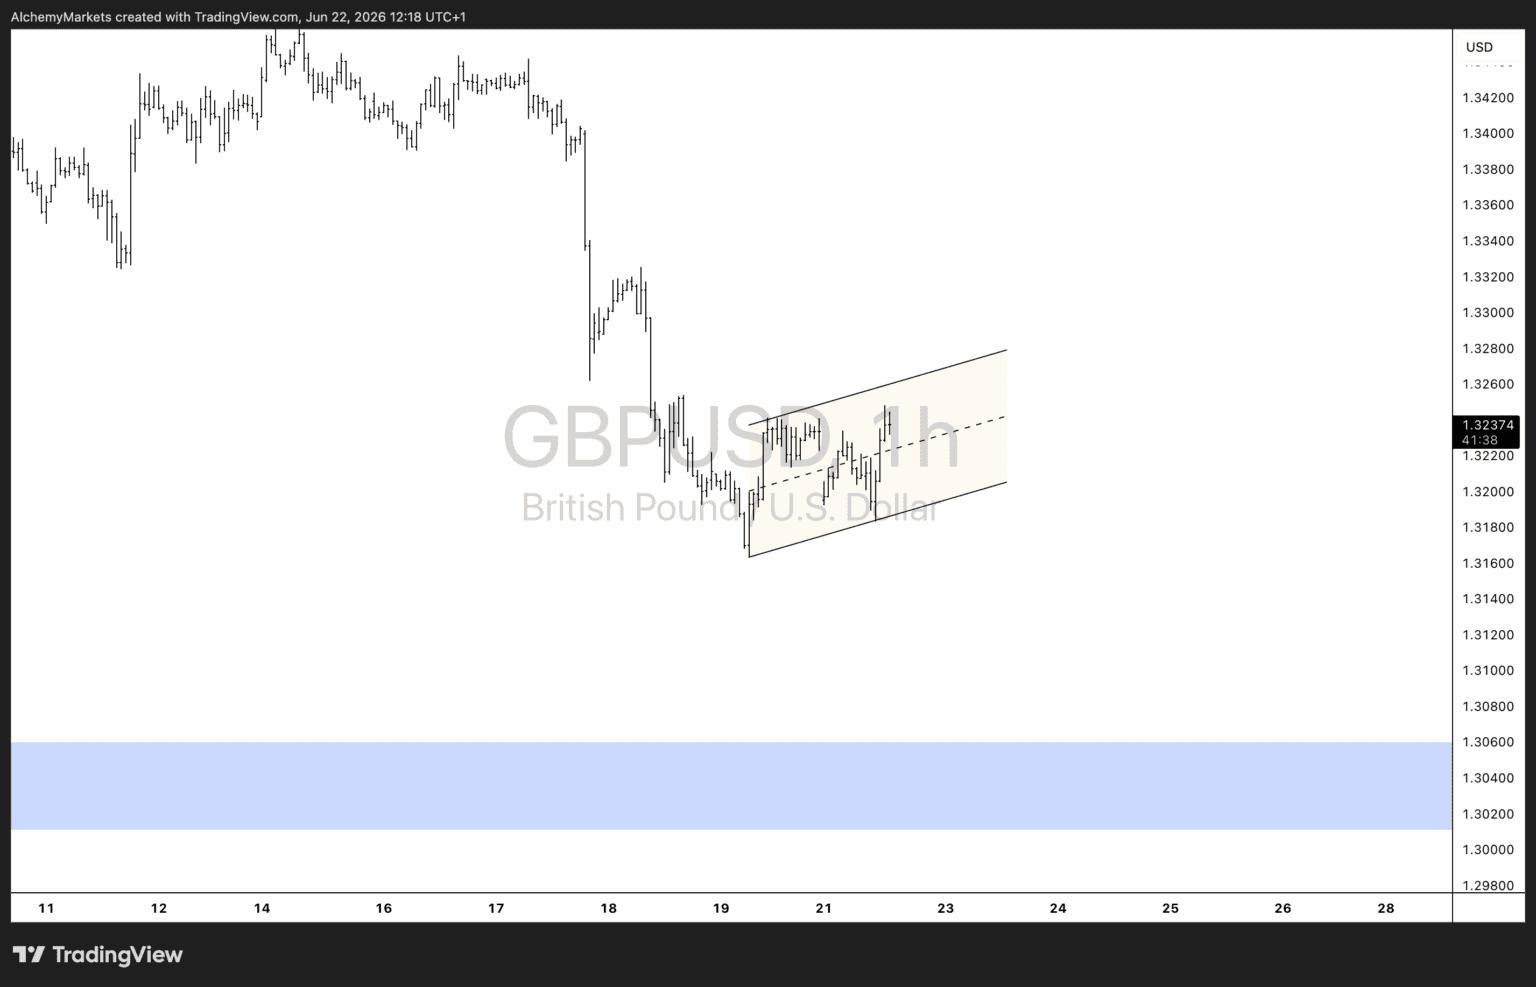
Drop to the one-hour and the near-term mechanics come into focus. Friday’s leg lower from 1.3400 was sharp, and since then price has carved a tight rising channel between 1.3165 and 1.3250. On the surface that looks like recovery. In context it has the shape of a bear flag, a shallow countertrend drift inside a larger downtrend.
The upper boundary of that flag is now running into a wall of resistance: the descending daily mid-line sits just overhead around 1.3260 to 1.3280, which is exactly where the rally stalled before. Two timeframes, one resistance zone. That is the confluence that makes the flag interesting rather than just another consolidation.
The level that resolves it is the flag’s lower boundary near 1.3165. Hold above and the countertrend bounce has room to keep annoying the bears. Lose it, and the structure that has been containing price gives way, opening the path back toward the daily’s demand zone and the macro trendline beneath it.
The read
The story today is political, but the chart was set up well before Starmer’s statement. The daily defines the direction and the destination; the hourly defines the trigger and the timing. When a fundamental catalyst and a technical structure point the same way, the catalyst tends to get the credit the structure deserves.
Levels to watch sit in the article body. The flag boundary is the line in the sand. The demand zone below is the magnet. What happens between them is the trade.
Author

Zorrays Junaid
Alchemy Markets
Zorrays Junaid has extensive combined experience in the financial markets as a portfolio manager and trading coach. More recently, he is an Analyst with Alchemy Markets, and has contributed to DailyFX and Elliott Wave Forecast in the past.


