EUR/USD: Short-term sellers may control this week

Monthly timeframe:
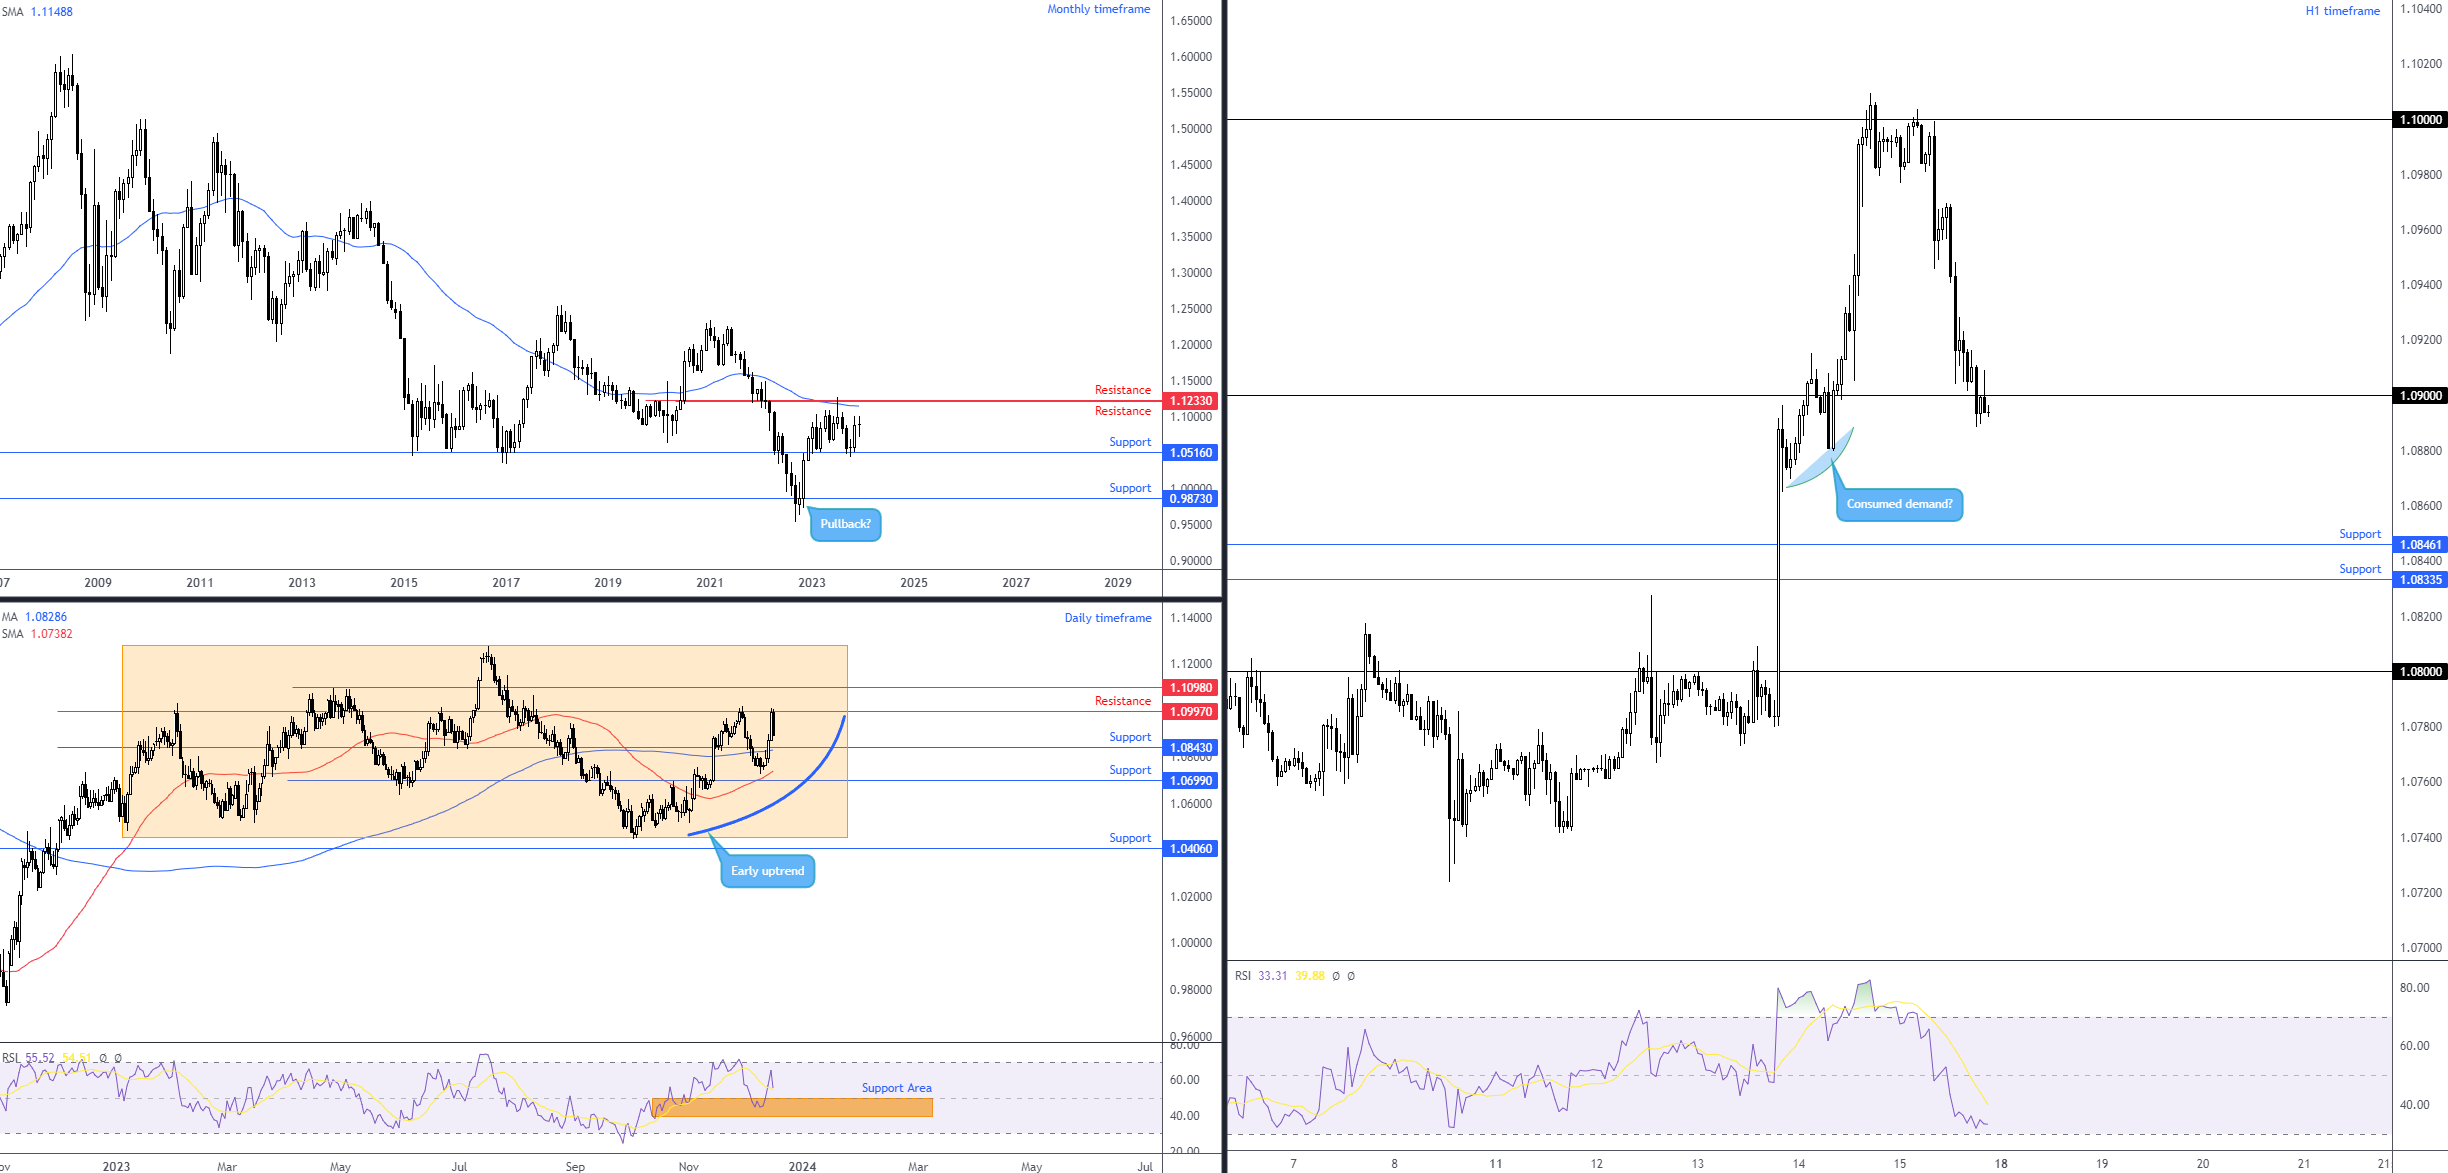
Month to date, compared to the US dollar, Europe’s single currency is marginally higher by +0.1%. Overall, though, the currency pair has been in a downward trend since 2008, fashioned through a series of lower lows and lower highs evident on the monthly timeframe. Also apparent from this chart, the pullback from the late September (2022) low of $0.9536 could be viewed as a long-term sell-on-rally scenario.
Monthly resistance warrants attention overhead at $1.1233, which shares chart space with a 50-month simple moving average (SMA) at $1.1149, in addition to monthly support from $1.0516, a level that welcomed buyers in November. Ultimately, given the downtrend in the EUR/USD, $1.1233 resistance will likely be a difficult barrier to penetrate and, thus, perhaps encourage selling if challenged again. Breaching current support, therefore, might also open the door to further downside towards monthly support at $0.9873.
Daily timeframe:
From the daily timeframe, you will note that price movement has not offered much regarding a clear trend since the early months of the year (orange box). Nevertheless, aided by the Relative Strength Index (RSI) presenting support between 40.00 and 50.00 (common in uptrends), an early uptrend has taken shape since the October lows of $1.0448: a series of higher highs and higher lows. For those who follow moving averages to determine trend direction, you will also acknowledge that price is north of both the 50-day and 200-day SMAs ($1.0738/$1.0829) and a Golden Cross pattern appears to be nearing, both of which are recognised bullish trend reversal signals.
Technical structures to have noted this week are support at $1.0843 and $1.0699 and resistances at $1.0997 and $1.1098. Beyond these resistances, a possible run back to the monthly resistance highlighted above at $1.1233 could be seen, while below current supports shines a light on support at $1.0406 (sited just south of monthly support mentioned above at $1.0516).
H1 timeframe:
Meanwhile, price action on the H1 timeframe wrapped up the week by retesting the underside of the $1.09 handle after dominantly rejecting $1.10. Limited support is seen until the area between $1.0834 and $1.0846.
Direction?
With price action on the daily timeframe rejecting the underside of resistance at $1.0997 on Friday with scope to press lower until reaching daily support at $1.0843 (and the 200-day SMA nearby at $1.0829), this may hand the baton to short-term sellers from $1.09 this week on the H1 chart towards support between $1.0834 and $1.0846.
Charts: TradingView
Author

Aaron Hill
FP Markets
After completing his Bachelor’s degree in English and Creative Writing in the UK, and subsequently spending a handful of years teaching English as a foreign language teacher around Asia, Aaron was introduced to financial trading,

















