EUR/USD: Sellers fail to penetrate 9th-order demand massif

Market context and the 9th-order demand defense
On the 1-hour timeframe, EUR/USD is exhibiting a profound structural stabilization near the 1.1205 mark. Over the past several trading sessions, aggressive institutional selling waves have repeatedly attempted to drive price lower. However, every downward impulse has met unyielding resistance, failing entirely to penetrate the monumental institutional demand floor established beneath current price action.
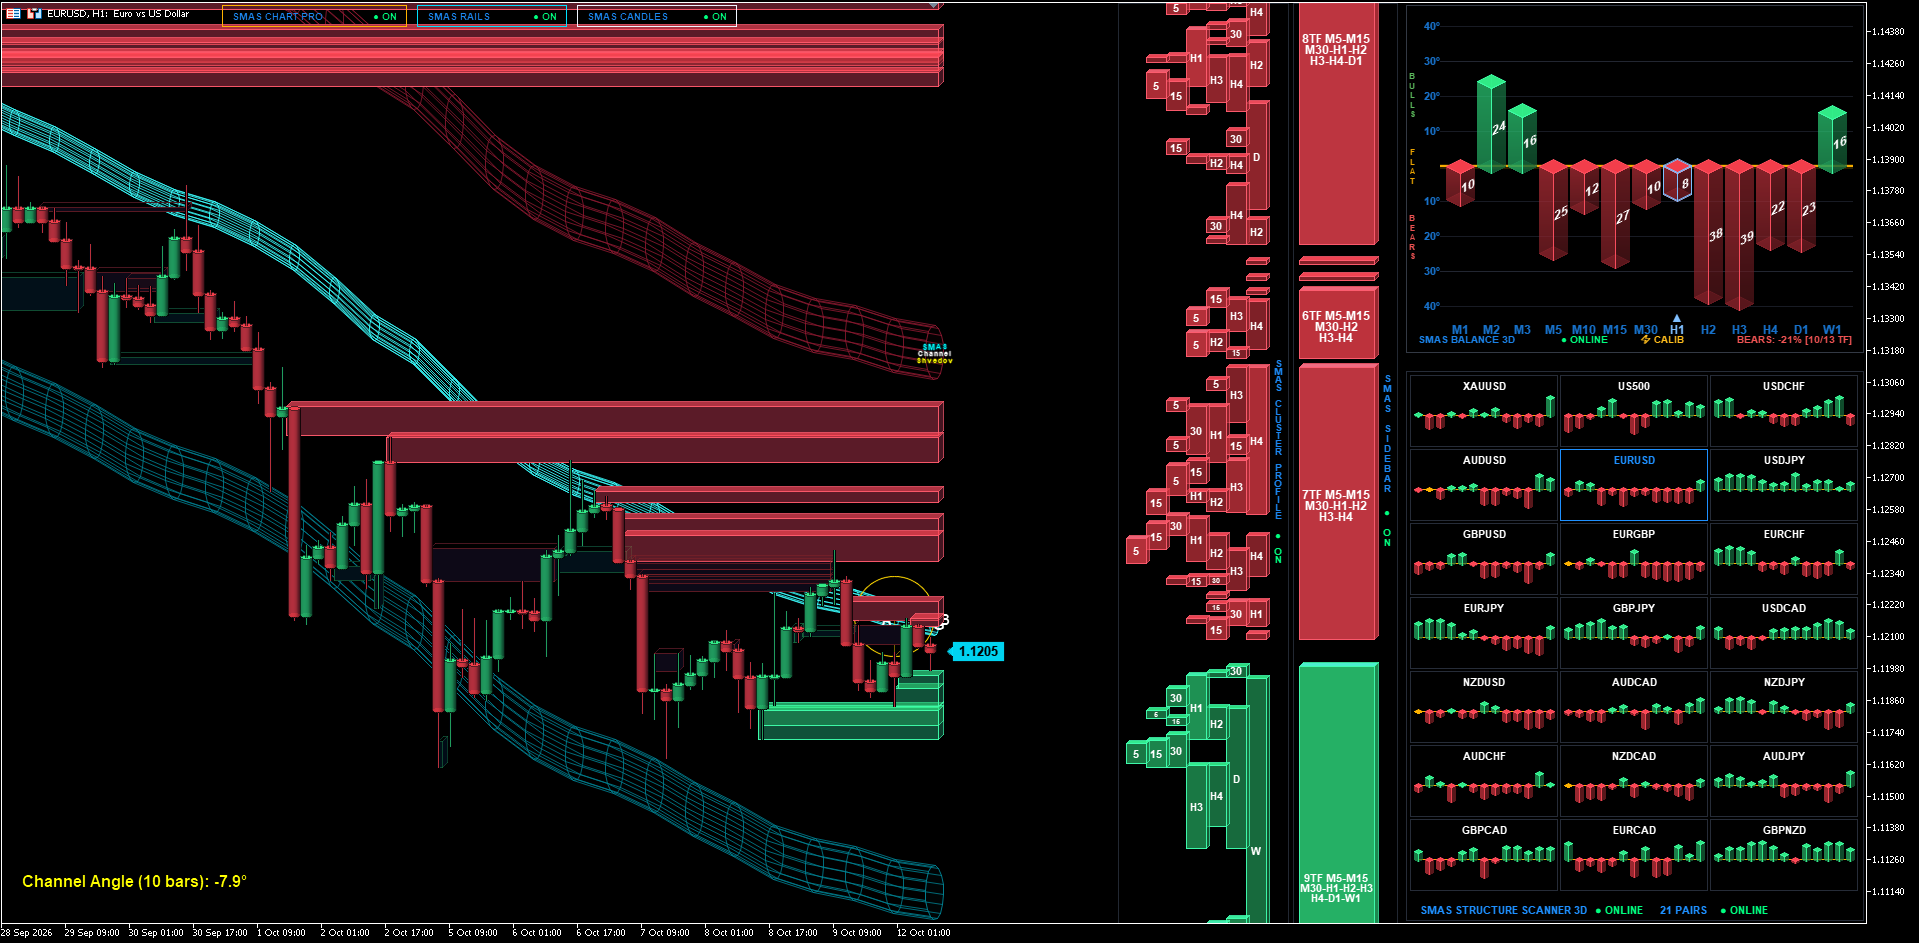
This inability of sellers to force continuation represents classic Sell Volume Absorption. Rather than accelerating downward, price action has entered a phase of localized horizontal equilibrium. The market is physically coiling against an immovable wall of limit buy orders, signaling that the directional momentum of the preceding decline has reached terminal exhaustion.
Cluster density analysis (Sidebar architecture)
Data aggregation via the SMAS Sidebar 3D reveals the extraordinary physical barrier defending the current price corridor:
- The underlying titanium plate: Directly beneath the market lies the rarest and most formidable structural barrier in financial markets — a 9th-Order Institutional Demand Super-Cluster (9TF: M5-M15-M30-H1-H2-H3-H4-D1-W1) spanning the 1.1140–1.1190 corridor. This signifies that nine independent temporal horizons—from the 5-minute scalping pulse to the multi-year weekly baseline—have independently generated confirmed institutional demand bases at this exact coordinate.
- Overhead resistance echelons: Any relief rebound will encounter tactical supply at the 7th-Order Cluster (7TF: M5-M15-M30-H1-H2-H3-H4) at 1.1230–1.1260, backed by an intermediate 6th-order massif (6TF: 1.1300–1.1330) and the macro 8th-order ceiling at 1.1380–1.1440.
Multi-timeframe phase telemetry (Structure balance 3D)
The Structure Balance 3D module captures the early stages of structural re-alignment:
- While intermediate frames (H2–H4 at -22° to -39°) still reflect residual historical selling momentum, microscopic synthetic slices have already initiated positive phase inversion: M2 (+24°) and M3 (+16°) have flipped firmly green, accompanied by a resilient Weekly macro anchor (W1 at +16°).
- This divergence between residual hourly selling and emerging micro-buying directly confirms the Spring Compression Pattern against the 9TF foundation.
Vector geometry and channel trajectory (Structure engine)
The SMAS Structure Engine provides definitive mathematical proof of trend exhaustion:
- The invariant slope angle of the dynamic regression channel has decelerated dramatically from -21.4° down to just -7.9°.
- This sharp flattening of the central OLS regression spine confirms that the first derivative of price trajectory is rapidly approaching zero (dPrice/dt→0). The market is transitioning from directional kinetic displacement into balanced structural consolidation.
Execution protocol and quantitative trade parameters
Because sellers have failed to breach the 9th-order demand massif, the asymmetric trading opportunity shifts to positioning for a mean-reversion rotation toward overhead supply:
- Order type: Buy Limit.
- Execution coordinate: 1.1195 (Upper boundary of the 9th-Order Demand Cluster 9TF).
- Structural invalidation (Stop Loss): 1.1135 (Placed safely below the 9TF titanium foundation; Risk: 60 pips).
- Target objective 1 (Take Profit 1): 1.1255 (+60 pips; Retest of the 7TF supply cluster lower perimeter; 50% volume realization & move Stop Loss to Breakeven).
- Target objective 2 (Take Profit 2, Final): 1.1325 (+130 pips; Core of the 6th-Order Supply Cluster 6TF).
- Risk / Reward Ratio: 1 : 2.17.
Momentum breakout trigger: An immediate H1 candle close firmly above 1.1235 confirms immediate absorption completion, authorizing a market entry targeting 1.1325.
Author

Andrey Shvedov
SMAS Quantum Research
Andrey Shvedov is an active quantitative trader, software architect, and financial market researcher with over 24 years of live market microstructure experience.

















