The EUR/USD is on the rising, staging a significant recovery and battling 1.1600. In the past, such movements have been dead-cat bounces. If this time is different, the pair may have more room to run.
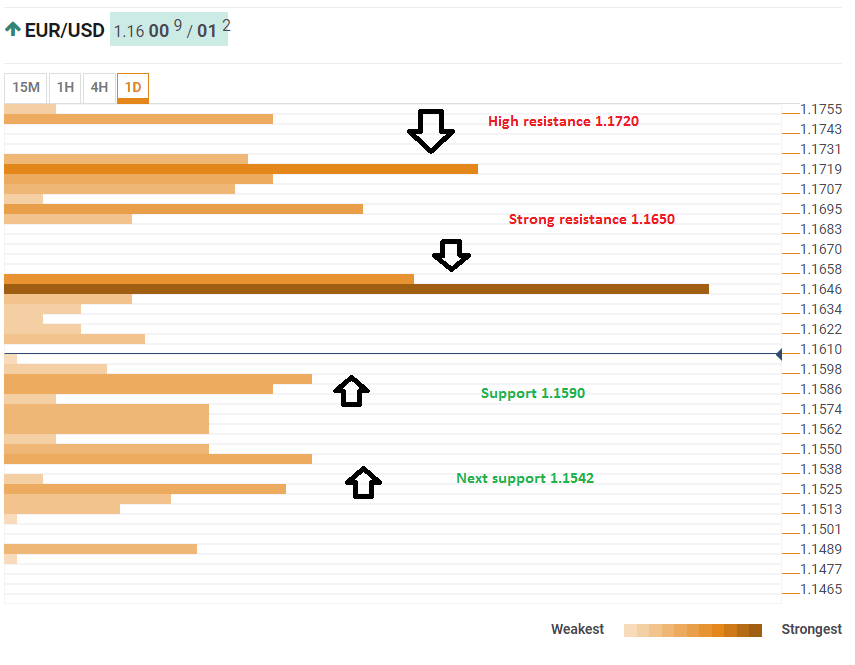
The Technical Confluences Indicator shows that the most significant convergence of technical lines is around 1.1650, which is the meeting point of the Simple Moving Average 5--one day, the one-month low, the one-week low, and the SMA 100-1h.
A break of that line opens the door to 1.1720 which is the confluence of the Fibonacci 38.2% one-week, the SMA 10-1 day, and the Fibonacci 161.8% one-day.
Some support awaits at 1.1590 where the Fibonacci 61.8% one-day, the SMA 5-15m, and the Pivot Point one-week Support 1 meet.
The next cushion is around 1.1542 which is the Fibonacci 23.6% one-day, the SMA 10-1h, the SMA 5-4h, and the Bolinger Band one-hour-Middle among others.
Here is how it looks on the tool:
Confluence Detector
The Confluence Detector finds exciting opportunities using Technical Confluences. The TC is a tool to locate and point out those price levels where there is a congestion of indicators, moving averages, Fibonacci levels, Pivot Points, etc. Knowing where these congestion points are located is very useful for the trader, and can be used as a basis for different strategies.
This tool assigns a certain amount of “weight” to each indicator, and this “weight” can influence adjacents price levels. These weightings mean that one price level without any indicator or moving average but under the influence of two “strongly weighted” levels accumulate more resistance than their neighbors. In these cases, the tool signals resistance in apparently empty areas.
Information on these pages contains forward-looking statements that involve risks and uncertainties. Markets and instruments profiled on this page are for informational purposes only and should not in any way come across as a recommendation to buy or sell in these assets. You should do your own thorough research before making any investment decisions. FXStreet does not in any way guarantee that this information is free from mistakes, errors, or material misstatements. It also does not guarantee that this information is of a timely nature. Investing in Open Markets involves a great deal of risk, including the loss of all or a portion of your investment, as well as emotional distress. All risks, losses and costs associated with investing, including total loss of principal, are your responsibility. The views and opinions expressed in this article are those of the authors and do not necessarily reflect the official policy or position of FXStreet nor its advertisers. The author will not be held responsible for information that is found at the end of links posted on this page.
If not otherwise explicitly mentioned in the body of the article, at the time of writing, the author has no position in any stock mentioned in this article and no business relationship with any company mentioned. The author has not received compensation for writing this article, other than from FXStreet.
FXStreet and the author do not provide personalized recommendations. The author makes no representations as to the accuracy, completeness, or suitability of this information. FXStreet and the author will not be liable for any errors, omissions or any losses, injuries or damages arising from this information and its display or use. Errors and omissions excepted.
The author and FXStreet are not registered investment advisors and nothing in this article is intended to be investment advice.
Recommended Content
Editors’ Picks
EUR/USD extends decline toward 1.0500 after US data

EUR/USD came under renewed bearish pressure and declined toward 1.0500 in the second half of the day on Monday. After the data from the US showed that the ISM Manufacturing PMI came in better than expected in September, the US Dollar extended its rally and weighed on the pair.
GBP/USD falls below 1.2150 as USD rally continues

GBP/USD turned south and retreated to a fresh daily low below 1.2150 in the American session. The US Dollar continued to gather strength against its rivals after the better-than-expected ISM September Manufacturing PMI data and forced the pair to stay on the back foot.
Gold falls to fresh multi-month lows below $1,830

Gold price turned south and dropped to its weakest level since early March below $1,830. The benchmark 10-year US Treasury bond yield gained traction on upbeat US PMI data and was last seen rising nearly 2% on the day above 4.6%, causing XAU/USD to stretch lower.
Week ahead: Fed speech and NFP likely to dictate crypto market moves this week

With the start of 2023’s fourth quarter, things are finally getting interesting in crypto. While the next 12 weeks are extremely important, let’s start by focusing on what to expect this week.
NIO contracts 2% as Tesla delivery decline weighs on EV sector

Nio (NIO) stock dropped 2.3% on Monday morning despite meeting its quarterly delivery target for the third quarter. Tesla's (TSLA) Q3 production and delivery decline is the culprit.