EUR/USD is testing a floor that has already been asked too much of

Looking at the EUR/USD chart this morning, the bulls don't have much of an argument. The world's most actively traded currency pair ran hard off the lows near 1.03400 in late 2024, climbing all the way to 1.21000 by early 2026.
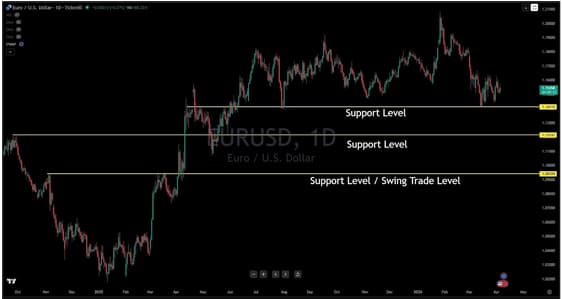
That was an impressive move. It's also over. Price has been unwinding from those highs, and at 1.15429 we are now pressing toward a level that has a complicated and telling history.
The level I keep coming back to is 1.14115.
Price has already visited this area multiple times, and that repeated interaction is the most important thing on this chart — not because it proves the support is durable, but because it suggests the opposite. Every time price returns to a support level, the buyers who step in to defend it are spending capital to hold the same ground.
The floor does not get reinforced by repeated touches. It wears down. Another test of 1.14115 tilts the odds toward a breakdown, and a confirmed daily close below it is the signal we are watching for that confirms the next leg lower is underway.
From there, 1.12141 is the first stop on the way down.
That intermediate level sits between the upper shelf and the more significant floor below, and it is where we would expect sellers to pause and some buyers to attempt a stand. But 1.12141 is not the destination, it is a waypoint.
The level that defines the entire swing trade thesis on this chart is 1.09399. That is the zone where EUR/USD consolidated for an extended period before launching the rally we just finished watching. Price has memory. The market made up its mind at that level once before, and that is where we would begin building a swing trade position once price gets into that area.
For traders who want to be more aggressive, the confirmed close below 1.14115 is the entry signal, you do not have to wait for 1.09399 to get involved. Just make sure you are defining your risk carefully, because the path between 1.12141 and 1.09399 is not guaranteed to be a straight line. Conservative traders will want to see price arrive at 1.09399 and show some structure before committing size.
The direction on this chart is south. That has been true since the 1.21000 highs, and nothing in this price action suggests it is about to change.
Author

Benjamin Pool
Verified Investing
A seasoned financial expert with a passion for empowering individuals to mastering smart money management.