EUR/USD Forecast: Under pressure ahead of US Consumer Price Index

EUR/USD Current Price: 1.0688
- A scarce macroeconomic calendar maintains the EUR/USD pair in a tight intraday range.
- The focus is on the US Consumer Price Index and the subsequent Federal Reserve reaction.
- EUR/USD is biased lower despite a near-term bounce, which could change course after US CPI.
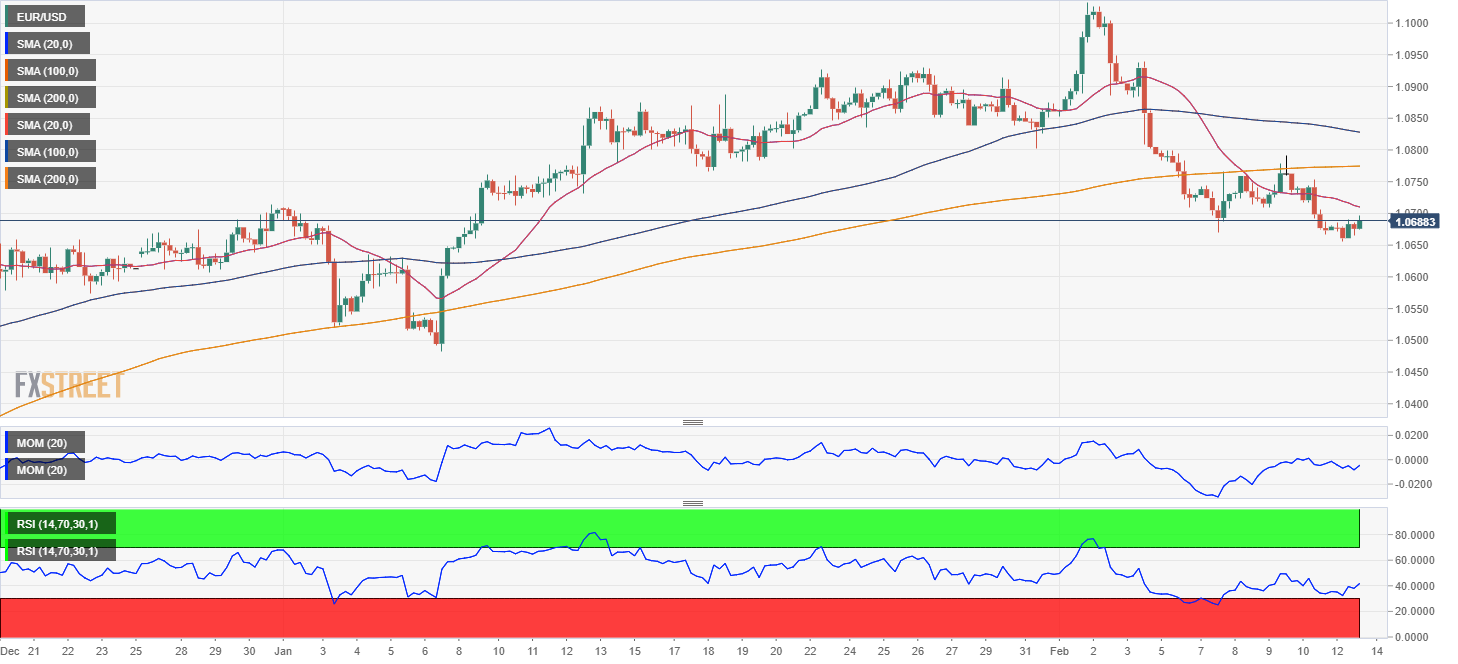
The US Dollar started the week with a strong footing, appreciating against most major rivals. EUR/USD bottomed at 1.0655 during Asian trading hours, now trading in the 1.0690 price zone. The American currency found favor in risk-averse markets, weighed by mounting expectations about future Federal Reserve (Fed) decisions. The focus is on the United States Consumer Price Index (CPI) to be out on Tuesday.
Asian government bonds edged lower, boosting yields ahead of Wall Street’s opening, while local stock markets fell into the red. European indexes, however, trade marginally higher, limiting the USD advance, now trading mixed across the FX board.
As for the Euro, the European Commission released the quarterly Economic Growth Forecasts report. The report fell short of supporting the local currency despite upward revisions to economic growth, now seen at 0.9% in the Euro Zone for 2023, and downward revisions to inflation. Price pressures are expected to be 5.6% this year and 2.5% in 2024.
The US macroeconomic calendar does not have relevant figures, favoring range-trading ahead of the first-tier event scheduled for Tuesday.
EUR/USD short-term technical outlook
The daily chart for the EUR/USD pair shows that it has posted a fourth consecutive lower low, which skews the risk to the downside. At the same time, the pair is developing below a mildly bearish 20 Simple Moving Average (SMA), while technical indicators lack directional strength within negative levels. Finally, the 100 SMA advances above the 200 SMA, both far below the current level.
In the near term, and according to the 4-hour chart, the ongoing advance seems corrective. The pair stands below all its moving averages, with the 20 SMA gaining downward traction below the longer ones. The Momentum indicator heads nowhere below its 100 line while the RSI advances, but it is currently at 42, not enough to anticipate a firmer recovery.
Support levels: 1.0655 1.0620 1.0570
Resistance levels: 1.0700 1.0745 1.0795
Author

Valeria Bednarik
FXStreet
Valeria Bednarik was born and lives in Buenos Aires, Argentina. Her passion for math and numbers pushed her into studying economics in her younger years.

















