EUR/USD Forecast: Optimism fades as US CPI looms

EUR/USD Current Price: 1.0912
- Better than anticipated Eurozone macroeconomic data underpin the Euro.
- The United States calendar has nothing relevant to offer ahead of inflation data on Wednesday.
- EUR/USD regains its upward potential but still needs to overcome the 1.0930 price zone.
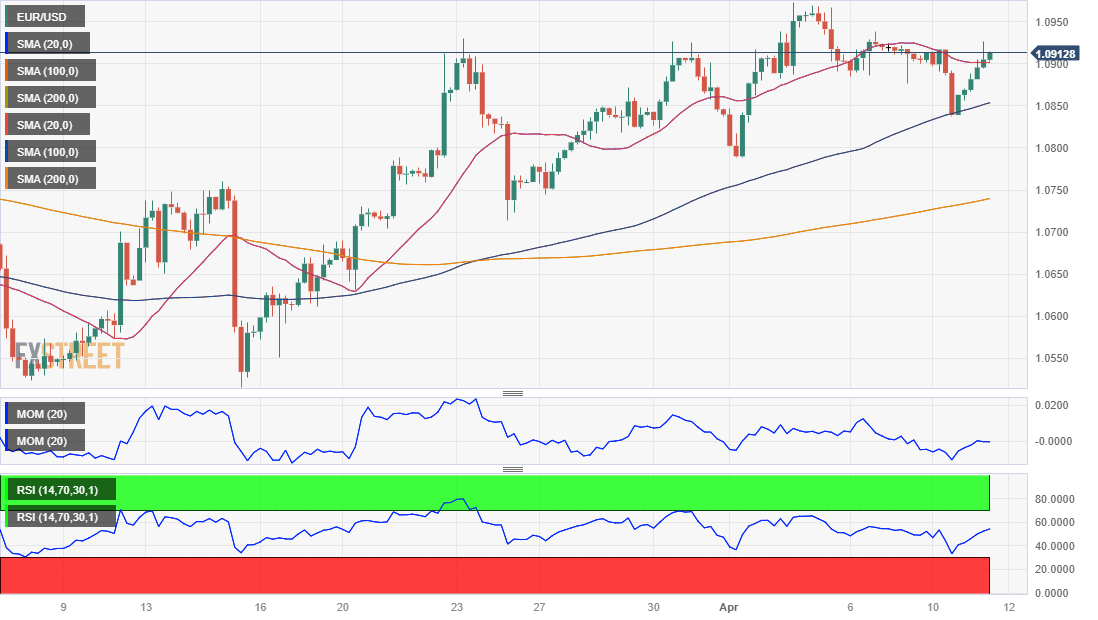
The EUR/USD pair changed course early on Tuesday and trades a handful of pips above the 1.0900 threshold. European indexes returned from the long weekend with optimism and rallied at the opening, weighing on US Dollar demand. The Euro found additional support on better-than-expected Eurozone figures. April Sentix Investor Confidence improved from -11.1 in March to -8.7. Additionally, Retail Sales were down 0.8% MoM in March, as anticipated, while the yearly comparison was slightly better than expected.
European equities markets lost momentum and trimmed part of their gains, which helped the Greenback recover some ground ahead of the US opening. Wall Street, in the meantime, aims to open in the red, while government bond yields hover around Monday closing levels.
The United States macroeconomic calendar does not include relevant macroeconomic data, but several Fed speakers will be on the wires. The focus remains on the US Consumer Price Index (CPI) scheduled for Wednesday.
EUR/USD short-term technical outlook
The EUR/USD pair has room to extend its recovery, according to the daily chart, with no signs of additional slides ahead. The pair continues to develop above bullish moving averages, with the 20 Simple Moving Average (SMA) resuming its advance above the longer ones. Meanwhile, the Momentum indicator has decelerated its decline, although it still heads lower just above its 100 level. The Relative Strength Index (RSI) indicator, on the other hand, has picked up an upward pace at around 58, in line with another leg north.
In the near term, and according to the 4-hour chart, EUR/USD is neutral-to-bullish. The pair bounced from around a bullish 100 SMA and currently develops above a directionless 20 SMA, the latter around 1.0890. Finally, technical indicators lack directional strength, stable around their midlines. Bulls will have better chances of a bullish breakout of 1.0930, a solid static resistance level.
Support levels: 1.0890 1.0835 1.0790
Resistance levels: 1.0930 1.0985 1.1020
Author

Valeria Bednarik
FXStreet
Valeria Bednarik was born and lives in Buenos Aires, Argentina. Her passion for math and numbers pushed her into studying economics in her younger years.