EUR/USD Forecast: Bulls fight back aim to regain 1.0900

EUR/USD Current Price: 1.0866
- OPEC+ unexpectedly announce an oil output cut of around 1.6 million barrels per day.
- US Treasury yields rose ahead of the opening amid renewed inflation-related concerns.
- EUR/USD turned bullish in the near term but still needs to confirm another leg higher.
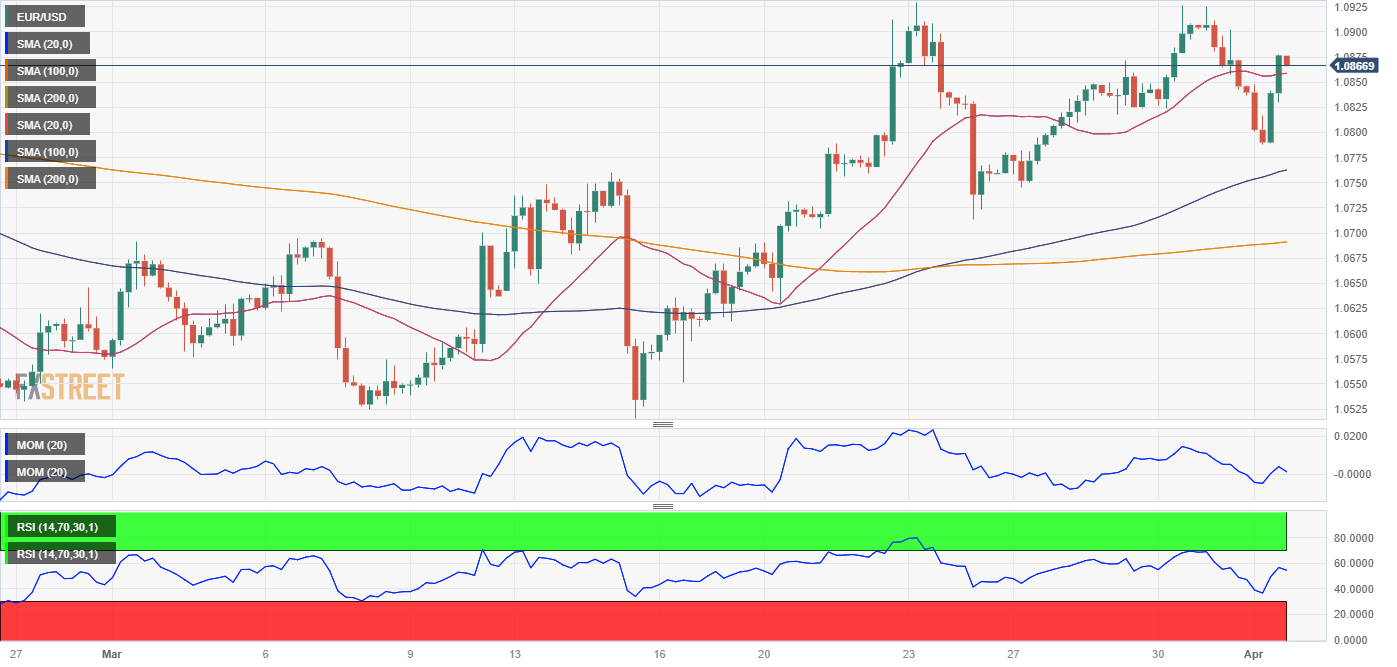
The US Dollar kick-started the day with a firm footing as risk-off dominated financial boards amid an Organization of the Petroleum Exporting Countries and allies (OPEC+) announcement. Major oil producers agreed on Sunday to further cut oil output by around 1.6 million barrels per day, pushing oil prices sharply up and reviving inflation-related concerns. EUR/USD declined towards 1.0787, its lowest in a week.
Further weighing on the market’s mood and boosting the Greenback, Chinese data missed market expectations. The March Caixin Manufacturing PMI printed at 50, easing from the previous 51.6 and missing expectations of an uptick to 51.7.
Demand for the American currency receded after London’s opening as the market mood improved, although concerns prevail. US Treasury yields rose ahead of Wall Street’s open and hold on to modest gains at the time being, with the 10-year note currently offering 3.50% and the 2-year note yielding 4.08%. EUR/USD recovered the 1.0800 threshold and trades near a daily high of 1.0877.
On the data front, S&P Global released the final estimates of the March Manufacturing PMIs for the Eurozone. The German figure was upwardly revised to 44.7, while the EU one also improved from the preliminary estimate from 47.1 to 47.3. The US session will bring the S&P Global and the official ISM Manufacturing PMIs, with the latter foreseen at 47.5 from 47.7.
EUR/USD short-term technical outlook
The daily chart for the EUR/USD pair shows that technical indicators turned flat within positive levels after a corrective decline, suggesting limited selling interest. At the same time, the pair keeps developing above bullish moving averages, with the 20 Simple Moving Average (SMA) now converging with long-term Fibonacci support, the 61.8% retracement of the 2022 yearly decline at 1.0745.
The 4-hour chart shows that bulls are battling to regain control. Technical indicators changed course after nearing oversold readings and currently head north above their midlines, although with limited strength. Meanwhile, the 100 SMA maintains its bullish slope below the aforementioned daily low, but EUR/USD struggles to overcome a directionless 20 SMA. Buyers could have better chances if the pair breaks through 1.0910, the immediate resistance level.
Support levels: 1.0830 1.0790 1.0750
Resistance levels: 1.0910 1.0950 1.1000
Author

Valeria Bednarik
FXStreet
Valeria Bednarik was born and lives in Buenos Aires, Argentina. Her passion for math and numbers pushed her into studying economics in her younger years.