EUR/USD Forecast: Bears taking the lead near-term

EUR/USD Current Price: 1.0865
- A holiday in Europe maintains most major pairs inside limited intraday ranges.
- Market players await US inflation figures scheduled for later this week.
- EUR/USD, under pressure, could extend its slump below 1.0800.
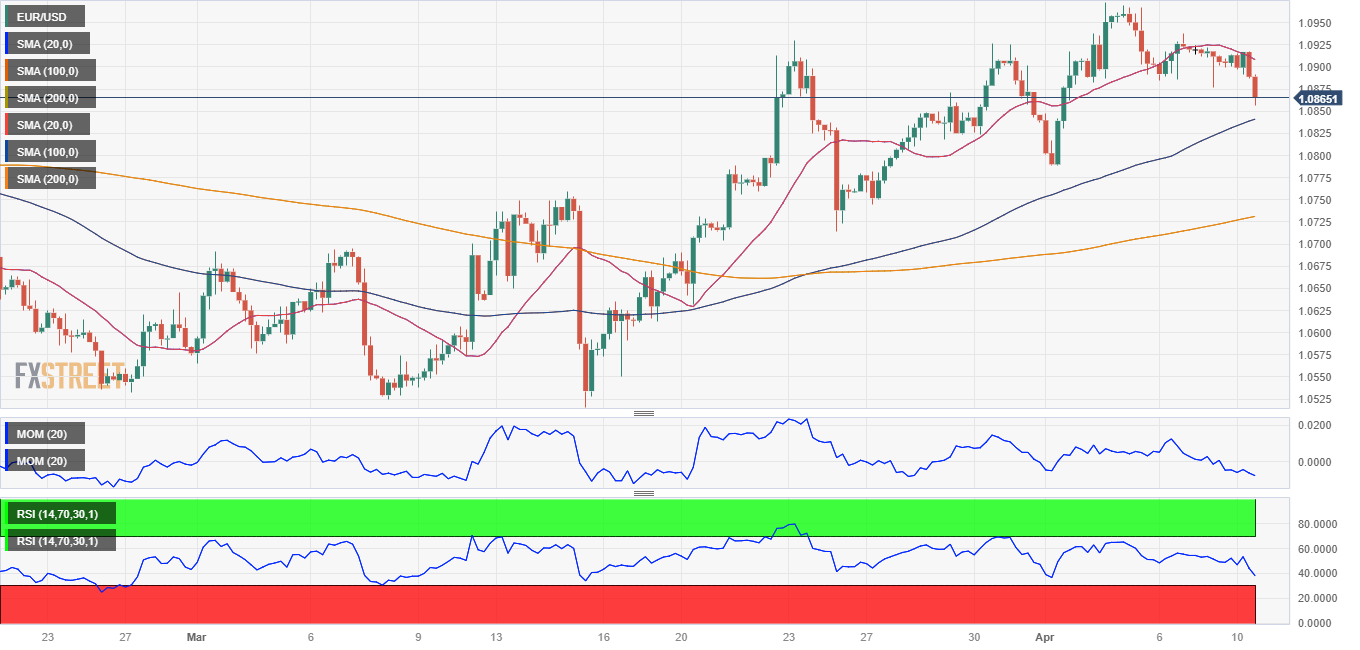
Financial markets await the American session opening, as most European markets are closed due to Easter Monday. The EUR/USD pair trades near a daily low of 1.0856 as investors gear up for a busy week and following a long weekend. The US Dollar briefly advanced in Asia as investors continued assessing the Friday strong United States employment report and higher government bond yields. It turned lower after Asian stock markets closed mixed, to later resume its advance ahead of Wall Street’s opening.
Still, a scarce macroeconomic calendar and first-tier figures scheduled for later this week maintain the pair inside a limited intraday range. The United States will publish the March Consumer Price Index (CPI) on Wednesday, expected at 5.2% YoY after printing 6% in February. The core reading, however, is foreseen at 5.6%, increasing from 5.5% previously. Also, the Eurozone will publish March Retail Sales on Tuesday, while Germany will unveil the final estimate of the Harmonized Index of Consumer Prices (HICP) on Thursday.
EUR/USD short-term technical outlook
The EUR/USD pair is under mild pressure, but technical readings in the daily chart are far from suggesting a steeper decline coming up. The pair remains above all its moving averages, with the 20 SMA partially losing its bullish strength and providing dynamic support at around 1.0810. At the same time, technical indicators continue to retreat from near overbought readings, heading south within positive levels.
The 4-hour chart shows that bears are taking advantage of thin trading. The pair accelerated its decline after repeatedly failing to overcome a mildly bearish 20 Simple Moving Average (SMA), although the longer moving averages maintain their bullish strength. The 100 SMA provides immediate support at 1.0830, with a break below it exposing 1.0745, the 61.8% retracement of the 2022 yearly slump and a strong static support level. Finally, technical indicators confirm the downward bias, heading firmly lower within negative levels after failing to retain positive ground.
Support levels: 1.0830 1.0790 1.0745
Resistance levels: 1.0885 1.0930 1.0985
Author

Valeria Bednarik
FXStreet
Valeria Bednarik was born and lives in Buenos Aires, Argentina. Her passion for math and numbers pushed her into studying economics in her younger years.