EUR/USD Forecast: Bears could soon retake control

EUR/USD Current Price: 1.0553
- The market mood improved despite escalating tensions in the Middle East.
- The United States will publish September Retail Sales on Tuesday.
- EUR/USD bounced on Monday, but the risk remains skewed to the downside.
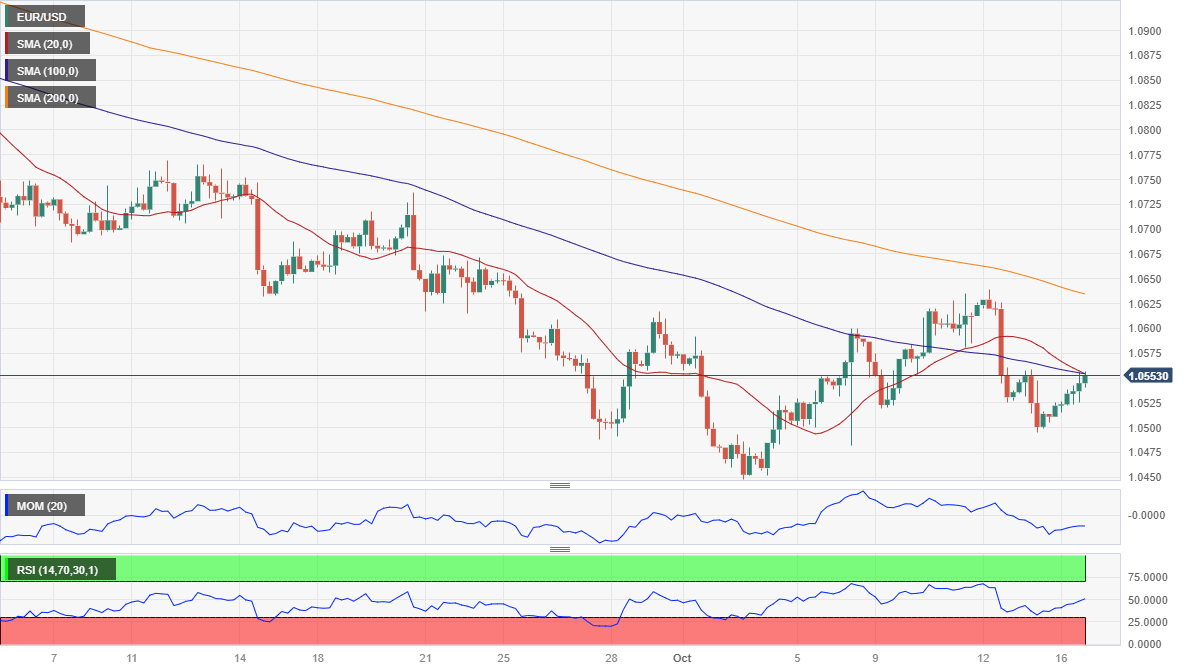
The EUR/USD pair edged higher on Monday, peaking at 1.0554 and heading into Wall Street’s closing trading a handful of pips below such a high. The week started with a firmer US Dollar, as tensions in the Middle East keep affecting the market mood. Demand for safety, however, receded as the day went by, with the USD giving up ground against all its major rivals.
The ongoing war between Israel and the Palestinian group Hamas escalated with the appearance of Hezbollah also attacking Israeli territory. At the same time, Israel plans to storm the Gaza Strip, leading to massive evacuations in the area. The situation fuels uncertainty about the global economic future and puts further pressure on central banks.
Data-wise, the week started in slow motion. Germany released the September Wholesale Price Index, which rose 0.2% MoM but declined by 4.1% from a year earlier. The Euro Zone unveiled the August Trade Balance, which posted a seasonally adjusted surplus of €11.9 billion, much better than the previous €3.5 billion. Finally, the United States (US) published the NY Empire State Manufacturing Index, down to -4.6 in the month from 1.9 in September.
Germany will release the October ZEW Survey on Economic Sentiment on Tuesday, while the US will publish September Retail Sales, seen up by a modest 0.3%. Later in the day, the country will release September Industrial Production and Capacity Utilization and August Business Inventories.
EUR/USD short-term technical outlook
From a technical point of view, EUR/USD advance falls short of hinting at another leg north. The intraday rally stalled below Friday’s high while the pair keeps developing below all its moving averages. The 20 Simple Moving Average (SMA) heads firmly south below the longer ones, acting as dynamic resistance at around 1.0570. Meanwhile, technical indicators have advanced, maintaining their upward slopes within negative levels.
The 4-hour chart offers a similar picture. The Momentum indicator heads north, although below its 100 level, while the Relative Strength Index (RSI) indicator grinds north at around 43. Nevertheless, a bearish 100 SMA capped advances, while a bearish 20 SMA approaches the longer one. Finally, the 200 SMA heads firmly south above the shorter ones, maintaining the risk skewed to the downside.
Support levels: 1.0495 1.0450 1.0400
Resistance levels: 1.0570 1.0610 1.0650
Author

Valeria Bednarik
FXStreet
Valeria Bednarik was born and lives in Buenos Aires, Argentina. Her passion for math and numbers pushed her into studying economics in her younger years.