EUR/USD Forecast: Bearish momentum increases as stalling growth spurs risk aversion

EUR/USD Current Price: 1.0720
- S&P Global downwardly revised European PMIs for August triggering demand for safe-haven assets.
- Goldman Sachs said chances of the US sliding into recession decreased.
- EUR/USD trades at its lowest since June, slide far from over.
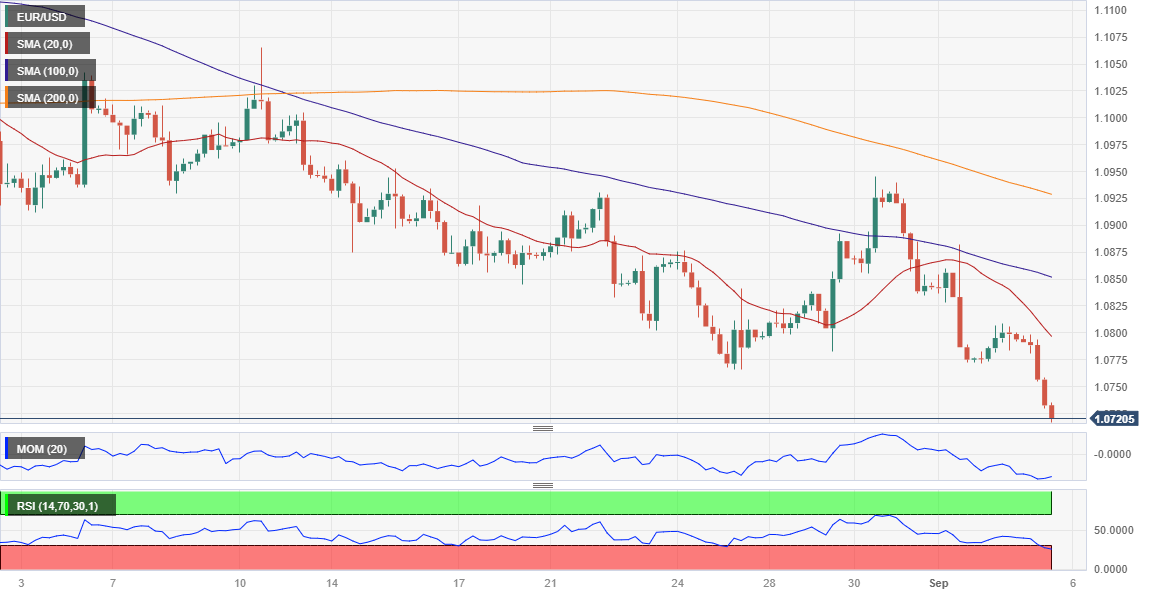
The EUR/USD pair fell through the August low and trades at levels last seen in June as demand for the US Dollar picked up amid a worsening mood. Data released in the Asian session showed that the Chinese Caixin Services PMI printed at 51.8 in August, easing from the previous 54.1 and indicating the slowest growth rate for this year. The news offset early optimism the economy was improving on the back of the latest governmental measures and sent stock markets into the red and investors into the safe-haven USD.
The Euro fell further after the release of the S&P Global Services and Composite PMIs. The final August figures suffered downward revisions, with the German Services PMI confirmed at 47.3 but the Euro Zone one resulting at 47.9 vs. the previous estimate of 48.6. The EU Composite PMI was reported at 46.7, an almost three-year low, “and broad-based across the manufacturing and services sectors as the latter contracted for the first time in 2023 so far,” according to the original report. On a positive note, the EU July Producer Price Index (PPI) was down 0.5% MoM in July and fell 7.6% compared to July 2022.
Meanwhile, Goldman Sachs revised the chance of the US sliding into recession to 15% from 20% previously on signs of easing inflation and a resilient labor market, suggesting the Federal Reserve may not need to tighten further.
The United States (US) macroeconomic calendar will include July Factory Orders and September IBD/TIPP Economic Optimism.
EUR/USD short-term technical outlook
The EUR/USD pair heads into Wall Street’s opening trading in the 1.0720 area, pressuring its intraday low and with scope to extend the slide. The daily chart shows that the pair collapsed below all its moving averages, while the 20 Simple Moving Average (SMA) extends its decline far above the current level, reflecting sellers’ strength. At the same time, technical indicators gyrated south while holding above oversold readings, leaving room for lower lows.
In the near term, and according to the 4-hour chart, the bearish case is even stronger. The 20 SMA accelerated south far above the current level and below the longer ones, which also gain downward traction. Furthermore, the Momentum indicator aims lower almost vertically, while the Relative Strength Index (RSI) indicator keeps grinding lower despite being at around 27.
Support levels: 1.0710 1.0670 1.0630
Resistance levels: 1.0765 1.0810 1.0850
Author

Valeria Bednarik
FXStreet
Valeria Bednarik was born and lives in Buenos Aires, Argentina. Her passion for math and numbers pushed her into studying economics in her younger years.