EUR/USD continental collision: 7th-order institutional demand slab meets -23.0° downward rail at 1.1190

Executive summary: The institutional collision thesis
Across retail financial media, current sentiment surrounding the European benchmark currency (EUR/USD) is gripped by aggressive bearish momentum. Following a sustained multi-week plunge from the 1.1600 handle, standard momentum oscillators and moving averages are flashing deep oversold readings, inducing late retail participants to chase breakdowns.
However, when audited through the multidimensional lens of the SMAS 3D Quantum Architecture, market reality reveals a classic Continental Collision. Price action has arrived at a structural inflection point where directional kinetic energy has become depleted against the lower two-sigma rail of the H4 regression channel, colliding head-on with a Titanium Plate of Institutional Capital: a massive 7th-Order Confluence Slab (7TF) anchored by Daily and Weekly accumulation baselines.
Below is a step-by-step forensic structural audit of the EUR/USD continuum across all five analytical modules.
Section 1: The master battlefield overview
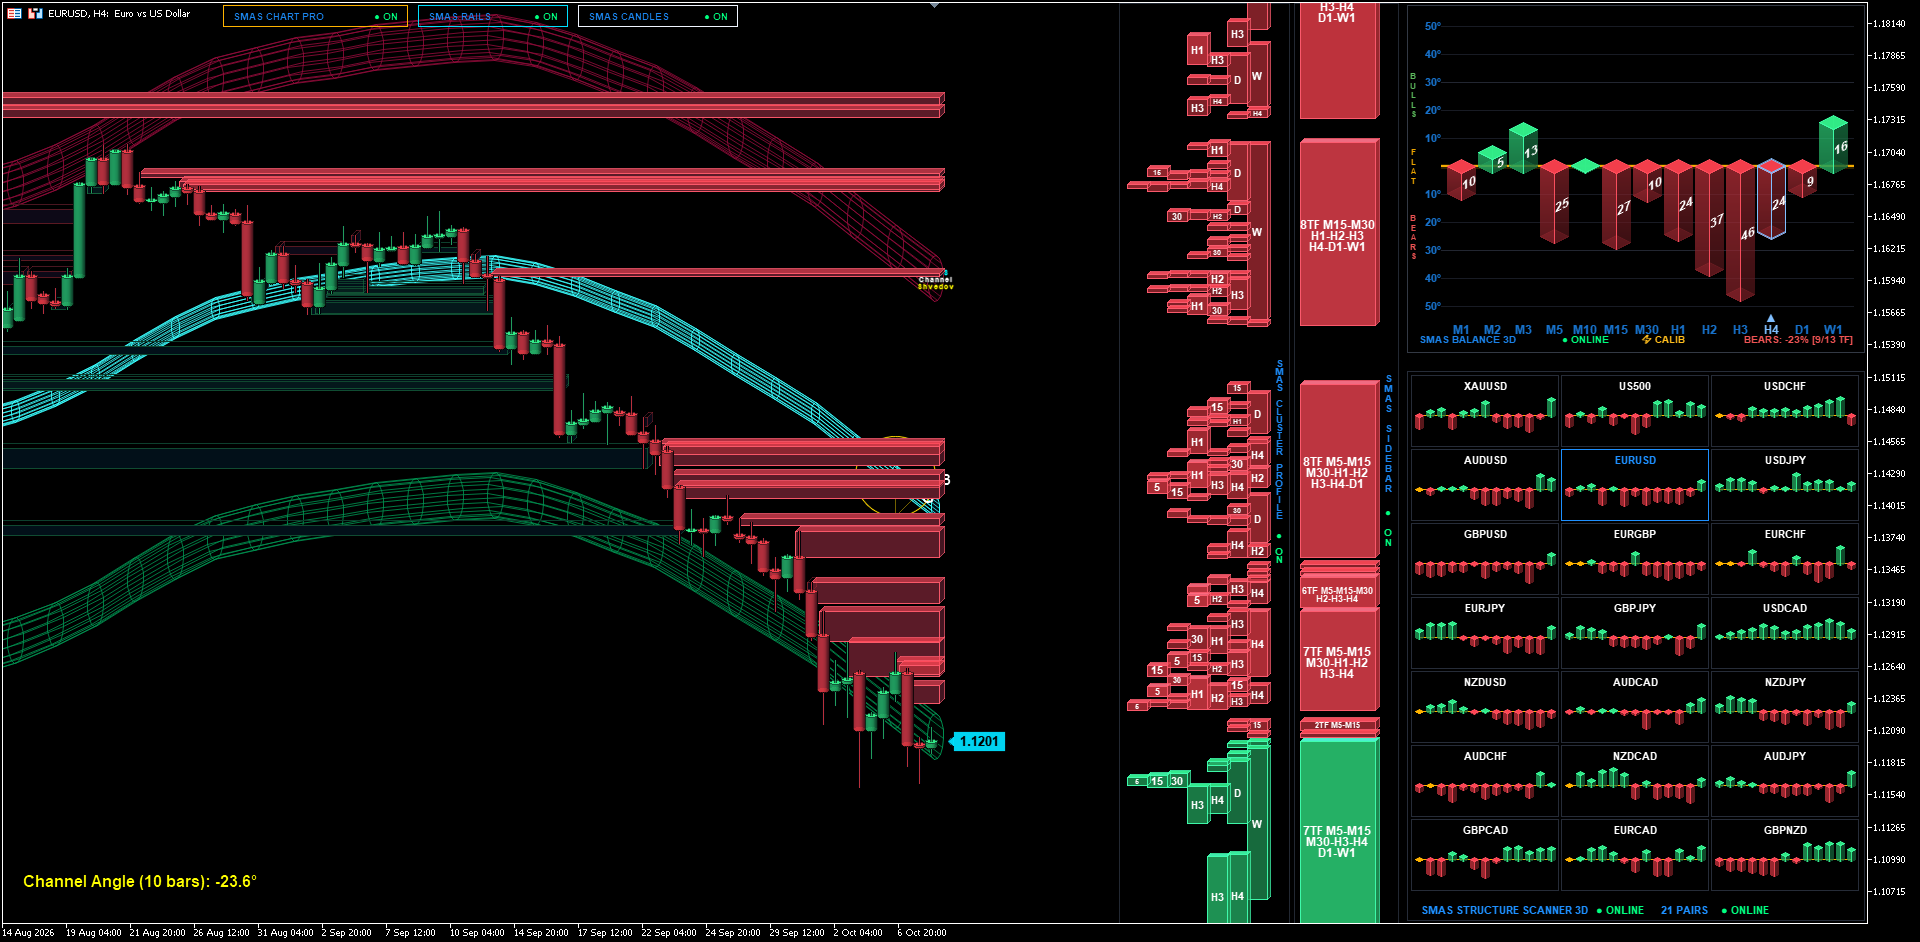
The master workspace provides total situational awareness by superimposing all operational layers onto the H4 execution continuum.
Price is currently trading at 1.1191–1.1194, compressed between two polarized structural forces:
- Overhead lies an impenetrable, multi-tiered fortress of bearish supply bases stretching from 1.1372 up to 1.1510.
- Directly beneath current spot price lies a monumental green demand continent.
The live Structure Scanner 3D (21 Pairs) confirms that the US Dollar index has exerted widespread pressure across the FX spectrum. However, while cross-pairs are experiencing secondary breakdowns, EUR/USD is exhibiting distinct signs of deceleration as it strikes the floor of its multi-month kinetic container.
Section 2: Structural microstructure and genesis of bases (Chart pro)
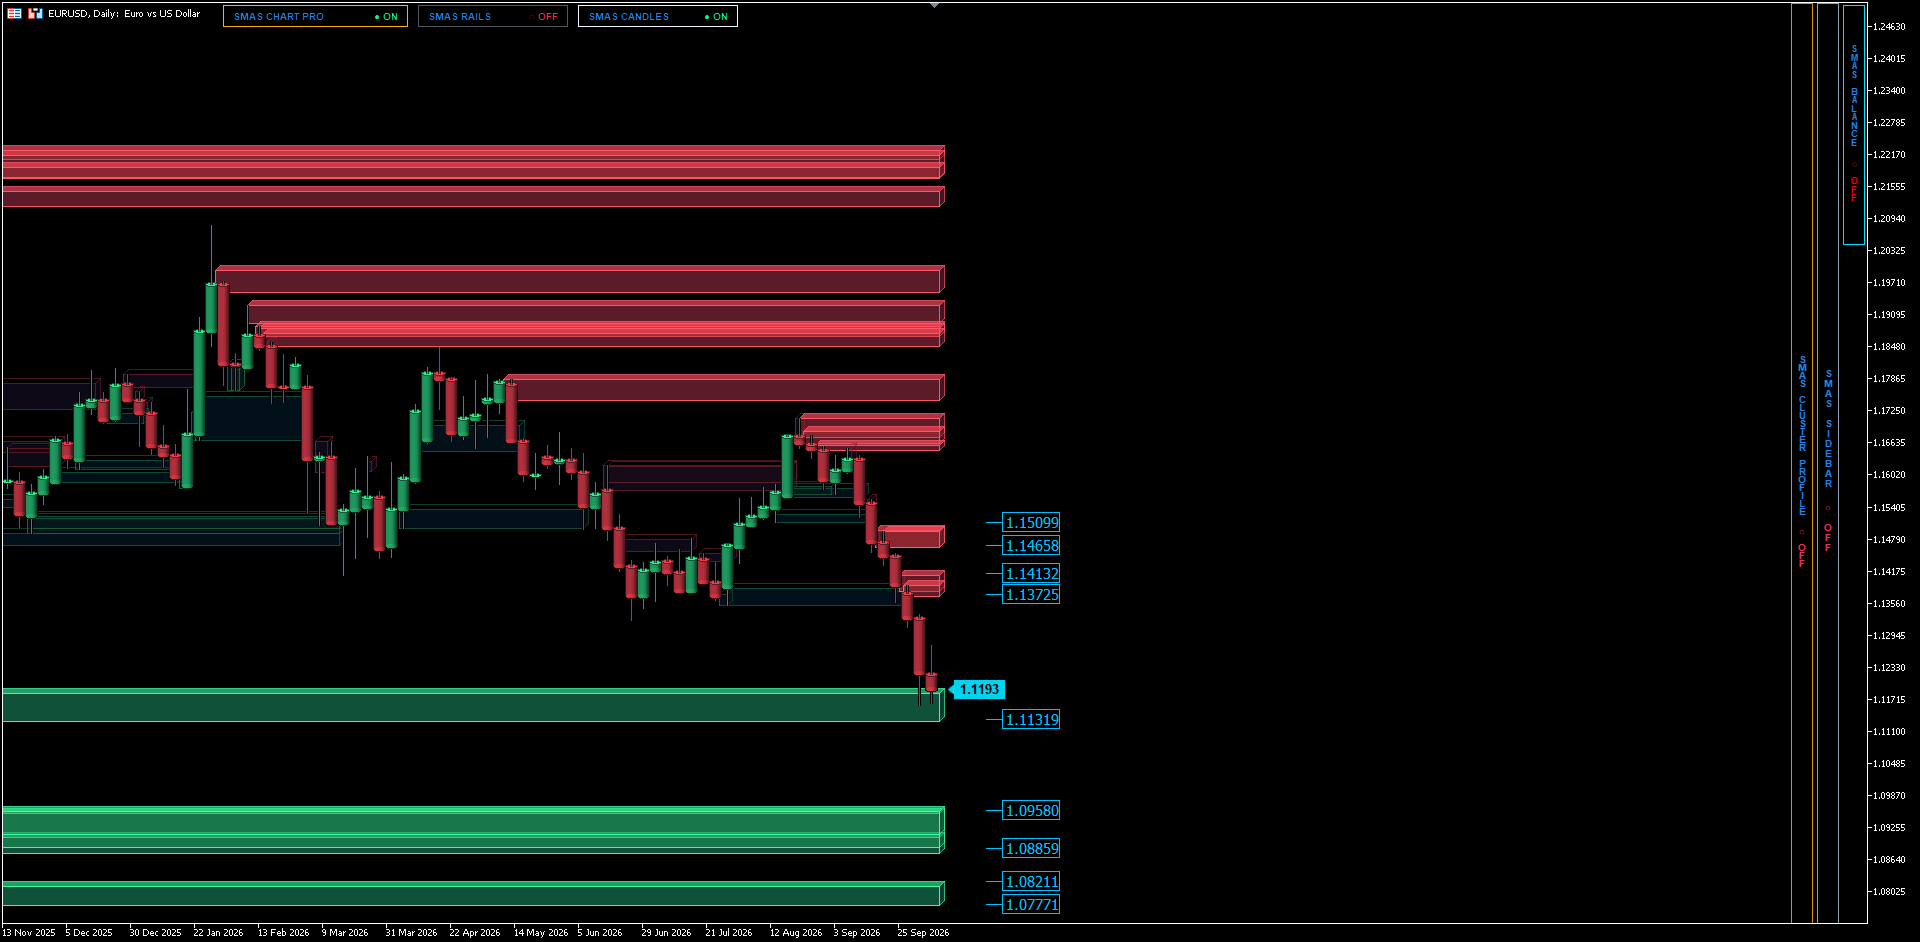
Examining the naked structural footprint on the Daily horizon through SMAS Chart Pro strips away cosmetic price noise and exposes the discrete coordinates of institutional liquidity:
Overhead supply massifs (The ceiling): The preceding decline was engineered through an unbroken series of institutional Drop-Base-Drop accumulation corridors:
- 1.13725 – 1.14132 (First-echelon structural barrier).
- 1.14658 – 1.15099 (Secondary institutional supply core).
The active demand floor: Spot price has collided directly with the upper boundary of the primary Daily Demand base at 1.1193, extending down to 1.11319.
This zone represents an authentic institutional base formed during prior macro accumulation. Because price has departed by more than 1.0H and returned for a formal first retest, the probability of aggressive volume absorption at this boundary obeys the invariant structural laws of double-auction order books.
Further down, secondary macro safety nets sit unmitigated at 1.09580 – 1.08859 and 1.08211 – 1.07771, establishing absolute secular support.
Section 3: Invariant vector geometry and kinetic exhaustion (Structure engine 3D)
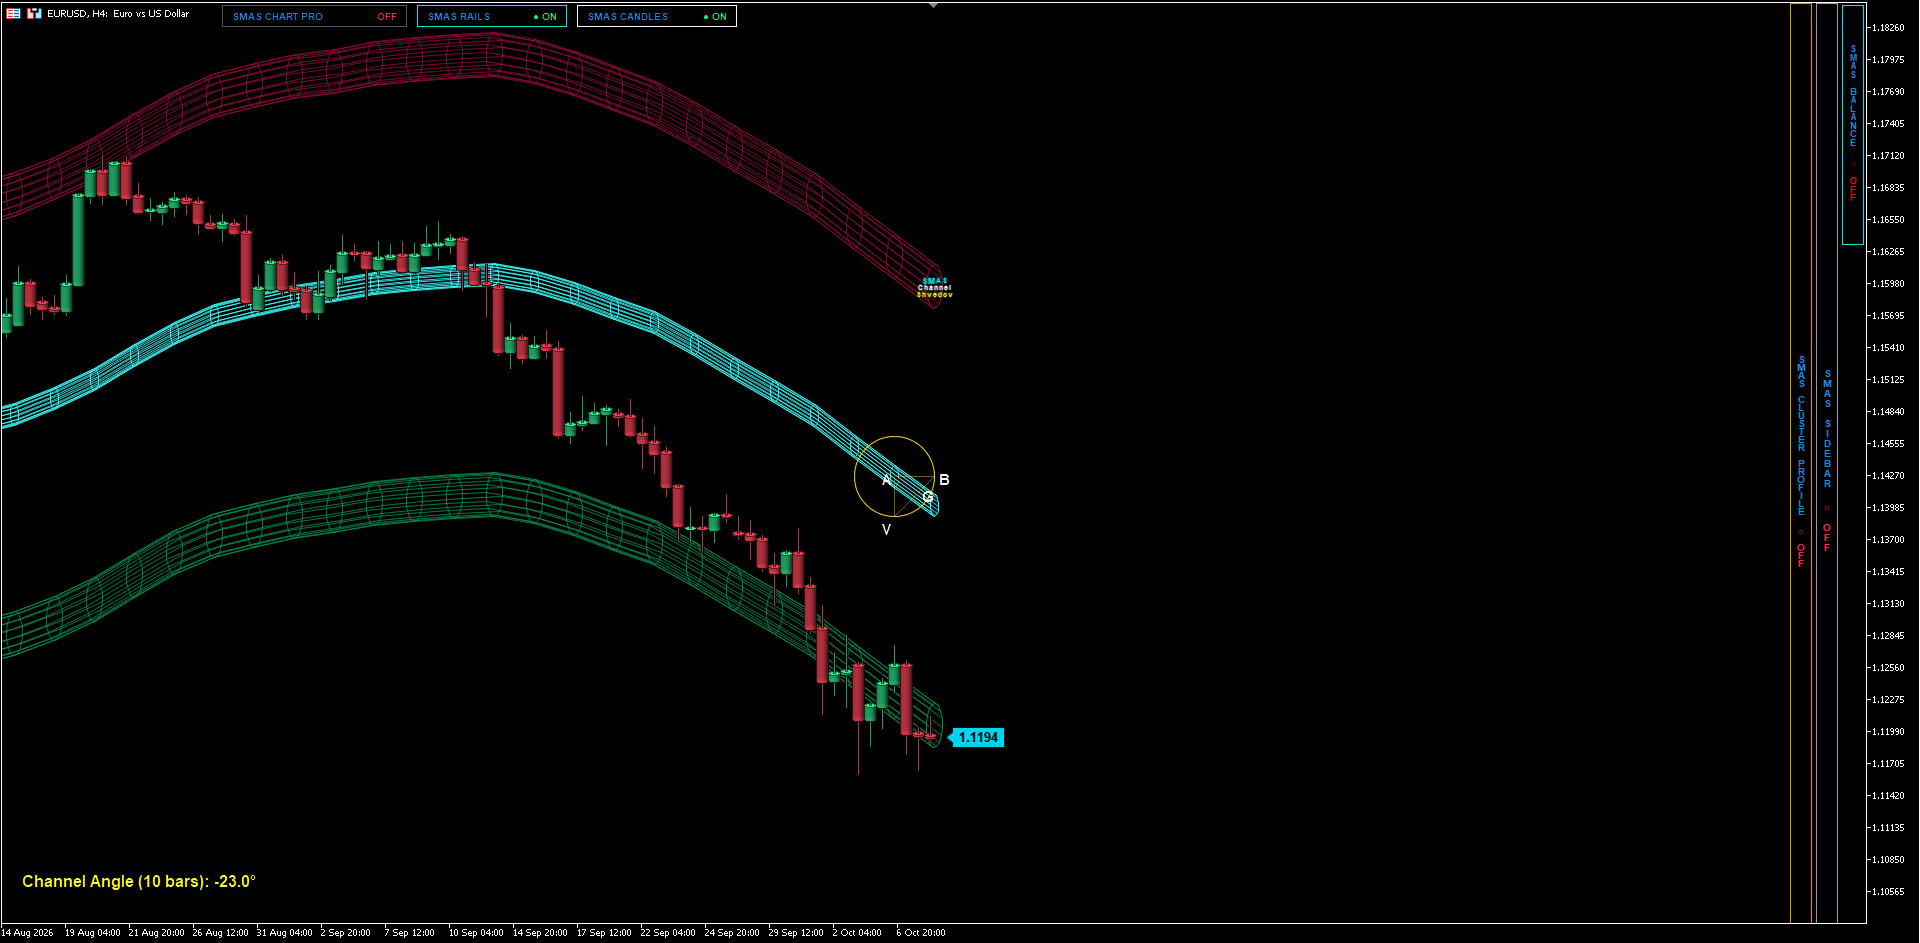
Conventional trendlines and Bollinger Bands fail under screen zoom and scaling due to the Aspect Ratio Paradox. To resolve this, the SMAS Structure Engine projects price and time onto an invariant circular manifold, constructing the scale-invariant geometric triangle A-B-V.
- Invariant Directional Angle: The calculated Structure Slope (BG/BV) over the active 10-bar window registers a steep downward gradient of -23.0° (and -23.6° on broader sampling).
- Terminal Rail Collision: Despite the strong downward momentum vector, the physical location of price at 1.1194 has struck the outer lower boundary rail calibrated to Two Standard Deviations (2σ).
According to Gaussian distribution of structural residuals,
95.45% of directional displacement is exhausted at this rail. Price has entered an extreme probabilistic boundary where the probability of further downward expansion without a violent mean-reversion counter-rotation drops below 5%.
Section 4: The 14-timeframe phase telemetry and spring compression
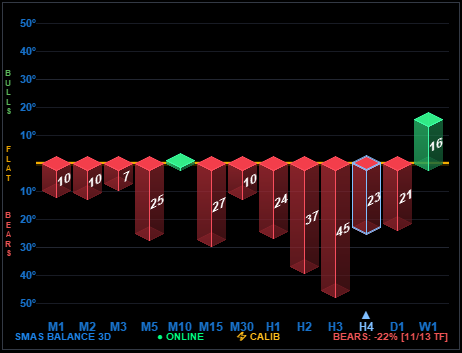
The Structure Balance 3D engine samples the real-time velocity and slope across all 14 timeframes simultaneously, including synthetic slices inaccessible in standard charting.
The telemetric histogram reveals the classic Spring Compression Pattern:
Intraday bearish cascade: 11 out of 13 active timeframes are locked in red negative territory, generating an aggregate bearish saturation of -22%:
- Micro horizons: M1 (-10%), M2 (-10%), M3 (-7%), M5 (-25%), M15 (-27%), M30 (-10%);
- Intermediate swings: H1 (-24%), H2 (-37%), H3 (-45%), H4 (-23%), D1 (-21%).
The secular anchor: In sharp contrast to the intraday cascade, the senior Weekly baseline (W1) stands as a towering green pillar at +16%!
The predictive Alpha lead: Notice the nascent inversion on the M10 synthetic slice, which has already flipped green to +3%!
When short-term selling waves (-22%) crash into a positive secular baseline (+16%), the market acts like a mechanical spring compressed to its absolute physical limit. The selling pressure is being passively absorbed by dormant institutional limit orders.
Section 5: The liquidity fortress (Sidebar 3D and cluster profile 3D)
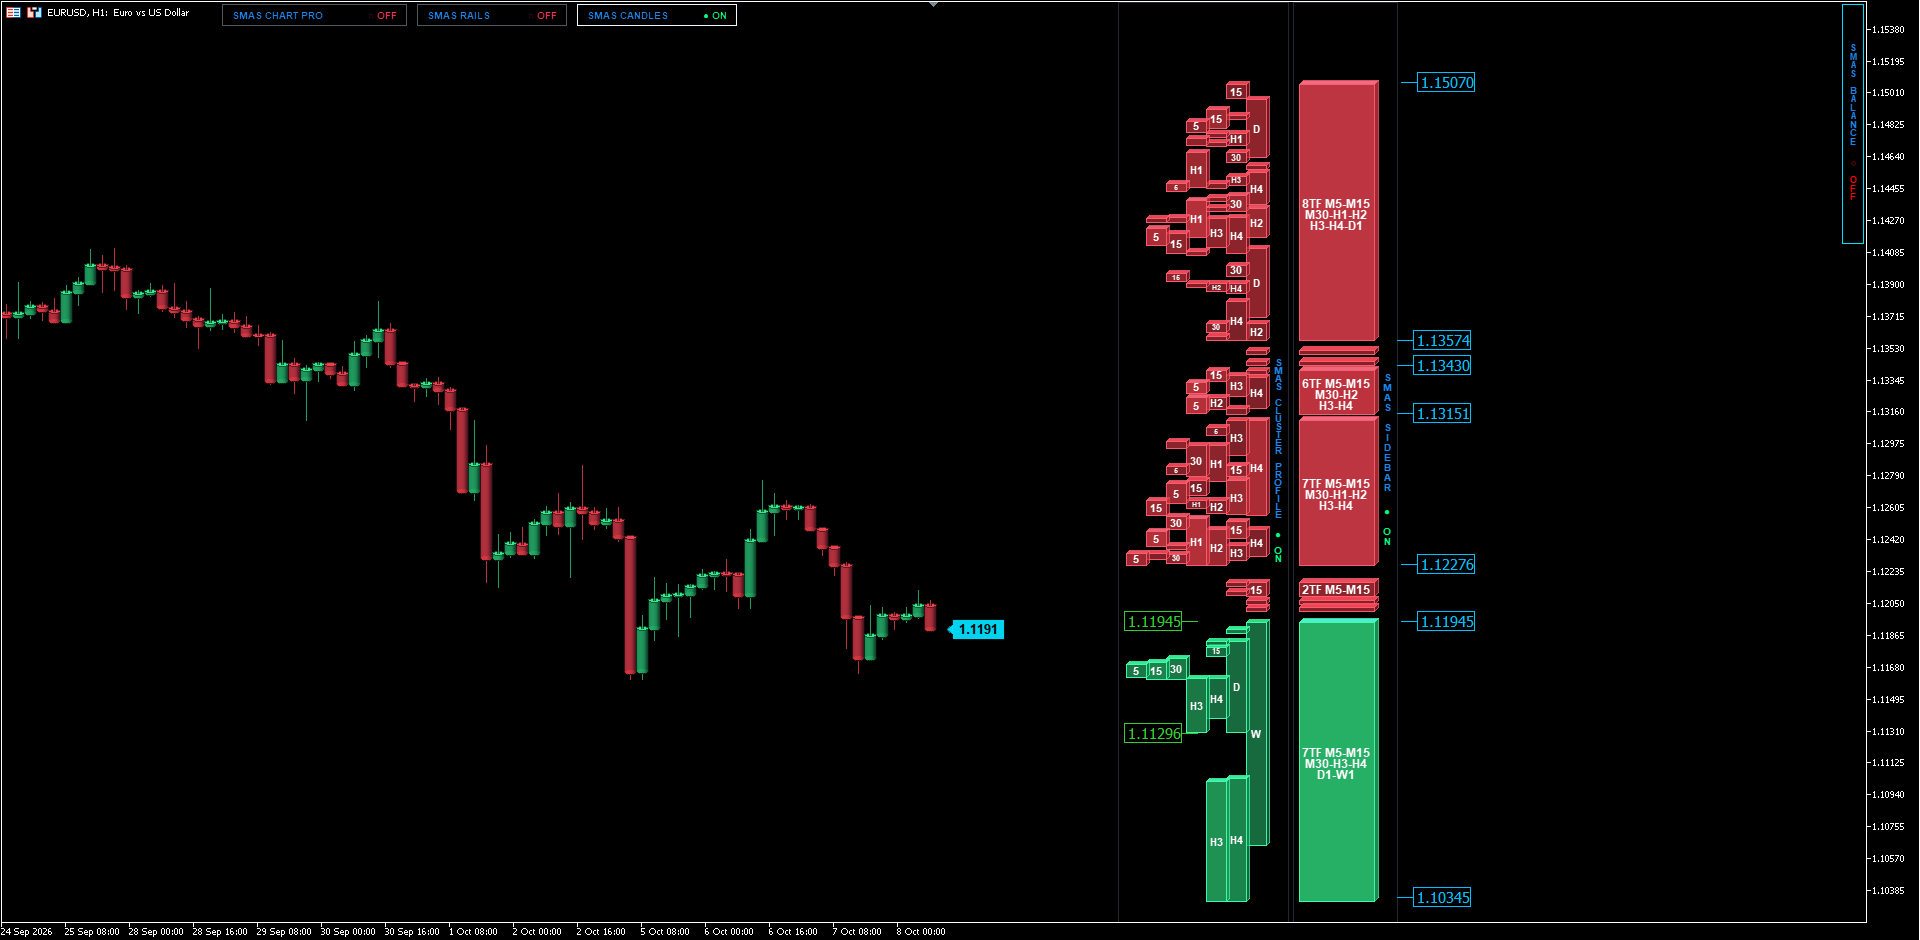
The true physical battleground is decoded along the vertical price axis through the integration of the Sidebar 3D and Cluster Profile 3D:
- The 7th-Order Super-Cluster (7TF Massif):
Directly beneath current price lies a colossal confluence massif of the 7th Order (7TF: M5-M15-M30-H3-H4-D1-W1), spanning from 1.11945 down to 1.10345. Seven independent time horizons have converged their accumulation footprints at this identical coordinate! - The Hardened Saturated Core:
The Cluster Profile 3D peers inside this 160-pip massif and reveals its geological seniority ranking. The highest concentration of institutional limit orders is tightly stacked in the upper sub-corridor between 1.11296 and 1.11945 (anchored by H3, H4, D1, and W1 bases). - Overhead Liquidity Ladder:
If an upward squeeze unfolds, price faces minor resistance clusters at 1.12276 (2TF: M5-M15) and a primary target cluster of the 7th Order at 1.12605–1.13151 (7TF), followed by the master 8TF barrier at 1.1390–1.1507.
Section 6: Actionable institutional execution protocol
Based on terminal rail collision at 2σ, the Spring Compression telemetry, and the physical absorption within the 7TF demand massif, late short positions present catastrophic risk-to-reward.
A high-convexity Long Mean-Reversion Scenario is formally activated:
Execution zone (Entry): 1.1170 – 1.1195 (Accumulation within the upper saturated core of the 7TF cluster).
Structural invalidation (Stop Loss): 1.1120 (Placed strictly beneath the primary H4/D1 demand shelf, risking approximately 65–75 pips).
Profit target 1 (TP1): 1.1265 (Lower boundary of the 7TF overhead resistance cluster and central OLS regression spine).
Action: Harvest 50% volume, systematically transition stop-loss to Breakeven (+0.1H).
Profit target 2 (TP2): 1.1345 – 1.1370 (Test of the primary 6TF/Daily supply ceiling).
Calculated risk-to-reward ratio: 1 : 2.5 to 1 : 3.2.
Author

Andrey Shvedov
SMAS Quantum Research
Andrey Shvedov is an active quantitative trader, software architect, and financial market researcher with over 24 years of live market microstructure experience.
















