ES Strategy this week: Wave 3 or a bear trap? [Video]


In Elliott Wave, one question decides a lot of trades: after a correction, is the next move a Wave 3 or a Wave C? Both go in the same direction, and at the start they look the same. But a Wave 3 is usually the strongest move of the cycle, while a Wave C can fall short and end in a reversal against you. Mixing them up is the difference between holding a winning trade and giving the profit back.
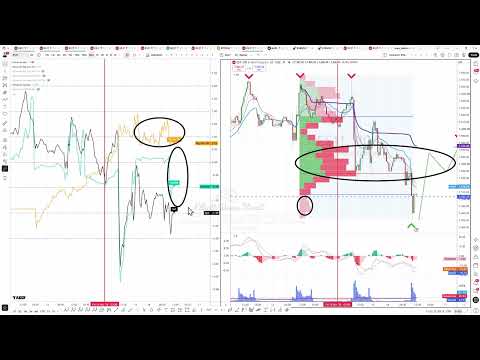
In short: the ES completed a five-wave sequence to the downside. This week we're looking for a short-term buy for Wave 2: the opening sell-off came on little volume, there's a big liquidity gap, and we're waiting for a MACD divergence on a fresh low. After Wave 2 we sell again — and the behavior of that decline will tell us whether it's a Wave 3 or a Wave C.
From the highs to the lows
Last week in the trading room we were looking for the market top and the sell side. After a double top, the ES built a five-wave sequence lower, with Wave 4 overlapping into Wave 1 territory — the signature of a leading diagonal.
Now we're at the other extreme. After five waves comes a three-wave correction: Wave 2. The plan is to exit the short, take a short-term buy for Wave 2, and once it's done, look for the sell side again.
Two scenarios after Wave 2
- If it's a Wave 3: big candles, and price could easily move back to the 7,320 area. Hold the short.
- If it's a Wave C: a choppy five-wave move that struggles to break down, with liquidity on the other side. Close the short and buy to capture a leg up.
One wave at a time
The rule at the heart of the video: don't trade waves that haven't happened. Focus on the next wave, always. Right now that's Wave 2. Once it shows the characteristics, the personality, and the liquidity of a Wave 2, then you plan the next one.
Volume Profile and liquidity: the Wave 2 buy
On the liquidity chart, price is at the extreme, at the end of Wave 5. The Volume Profile shows a big sell-off at today's open, but with combined volume that isn't significant. That makes a return to the point of control likely — the target area for Wave 2 (or B).
There's also a big liquidity gap between the Self and the Big Guy. Last week we traded the gap closing to the downside. This week, it points to a short-term buy — with extra care, since it goes against the bigger leg down.
On the 5-minute chart, the MACD shows momentum accelerating after the sell-off. We don't fight fast price action. The setup is a fresh low with a MACD divergence between the two lows, and the rejection to buy toward the VWAP.
What a Wave 3 looks like
Wave 3 is almost always the wave with the most momentum in an impulse. Clues to recognize it:
- Big candles, shallow pullbacks. Price moves easily and bounces are short.
- Momentum peaks. On the MACD, Wave 3 usually prints the histogram's extreme; divergence typically shows up in Wave 5, not Wave 3.
- Expanding volume. Participation grows as the move develops.
- It breaks the end of Wave 1 with force, and often extends beyond 1.618 times Wave 1.
What a Wave C looks like
Wave C completes a correction. It has five waves, like Wave 3, but a different personality:
- Choppy, overlapping price action. When Wave C takes the form of an ending diagonal, the overlap is obvious.
- Momentum fades at the end: a MACD divergence against Wave A or within its own fifth wave.
- A ratio to Wave A: often equal to Wave A, or 1.618 times in deeper corrections.
- Trouble breaking key levels, with liquidity on the other side.
Why one wave at a time
Every completed wave adds information. When Wave 2 ends, you don't yet know whether a Wave 3 or a Wave C is coming — but the sell makes sense in both scenarios. What resolves the doubt is the behavior of the next decline: speed and rising momentum point to Wave 3; choppiness and weak momentum point to Wave C. Plan several waves ahead and you commit to a scenario before the market has given you the information to choose.
The core idea
Wave 3 and Wave C start the same way and end very differently. You don't have to guess which one it is in advance: trade the next wave, let price behavior and liquidity tell you which scenario is unfolding, and adjust when the market confirms it.
That's the plan we're following this week in the Elliott Wave Street trading room, one step at a time.
Have you ever held a trade waiting for a Wave 3 that turned out to be a Wave C? Leave it in the comments on the video.
Author
Juan Maldonado
Elliott Wave Street
Juan Maldonado has a University degree in Finance, and Foreign trade started his trading career in 2008. Since 2010 has been analyzing the markets using Elliott Wave with different strategies to spot high probability trades.