Silver leads Gold to new 2026 lows: What the ratio says


At the moment of writing these words, December gold futures trade near $3,880, after an overnight slide to $3,835.20, their lowest level since September 19, 2025. Silver fell more. December silver futures trade near $47, after a move down to $46.885, their lowest level since September 25, 2025, and the gold-to-silver ratio is at about 82.7, its highest level since November 2025.
Silver's weakness isn't new. It's the continuation of a decline that started right at the level that I had pointed to.
Silver topped at my $120 target
On January 27, 2026, a day after silver's reversal at $117.75, I wrote: "The intraday reversal in silver just below my $120 target (at $117.75) might have marked the final top for the time being, or we might see another attempt that takes silver to $120 or even a bit above it before a bigger decline".
Two days later, March silver futures moved to $121.785, and then they collapsed. On January 30, they closed at $78.531. Since the top, silver has lost about 60 percent.
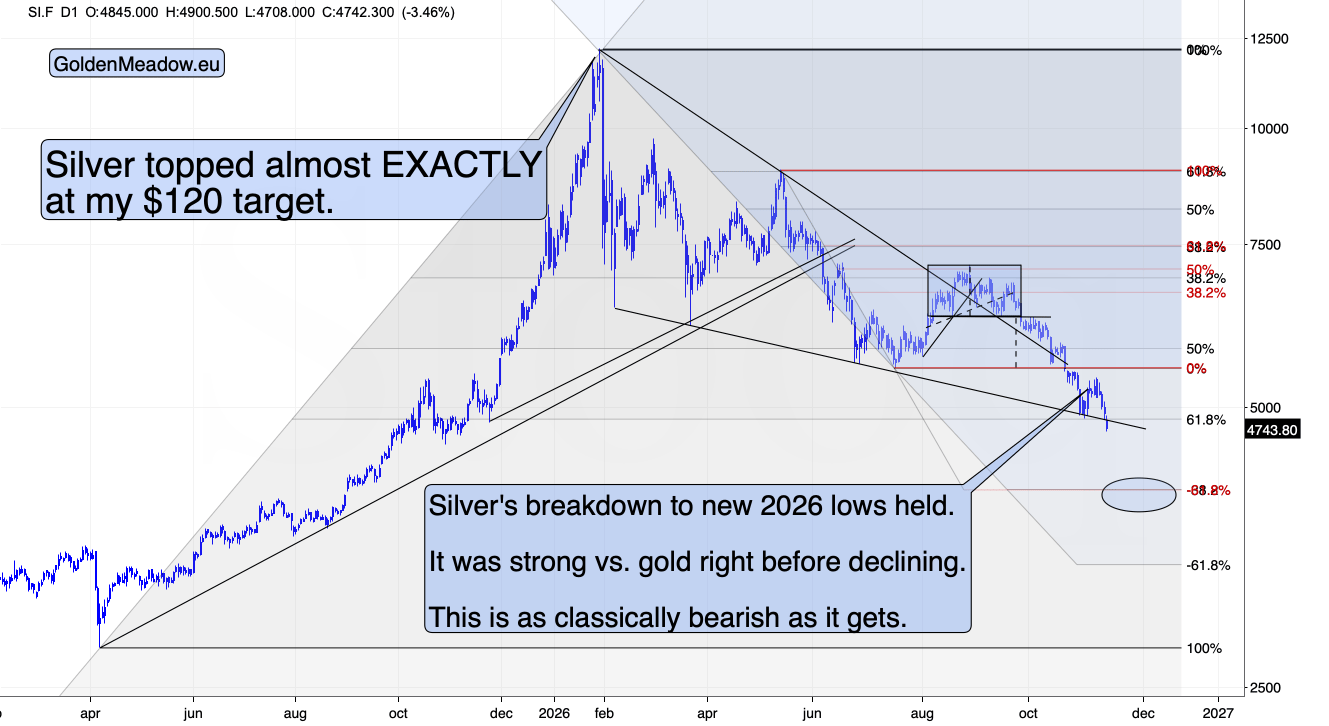
The decline didn't move in a straight line, and silver's moments of strength marked the tops along the way. On October 1, when silver traded near $61, I wrote: "The next sizable move is likely to be to the downside." In the same article, I added that "we took profits from the long-term silver investments above $100". Since October 1, silver has declined by about 23 percent.
Last week, silver showed the same kind of strength once again.
Silver's strength came right before the slide
On Wednesday, December silver futures rallied $0.777, while gold declined $29.70. On Thursday, silver lost $1.937, and on Friday, it fell $0.944 to $49.121, its lowest close since October 27, 2025, while gold closed $1.00 higher. On Sunday evening, silver dropped from about $48.75 to below $47.50 within an hour.
This is how silver tends to behave near tops. Silver is a much smaller market than gold, and it's partly an industrial metal, so it moves more in both directions. People tend to pile into weak markets because they look cheap, without considering that they might be cheap for a reason.
The same logic applies to the ratio.
What a Gold-to-Silver ratio above 80 tells us
The gold-to-silver ratio shows how many ounces of silver one ounce of gold buys. It rose from 77.6 on Thursday to 79.1 on Friday, and it's at about 82.7 today.
A ratio above 80 might make silver look like a bargain, but 2013 shows why it isn't a buy signal on its own. Based on the June 2013 gold futures and the July 2013 silver futures, the ratio was 55.2 on March 21, 2013, at the top of gold's final rebound, and 58.6 on April 16, at the low of the April crash. On June 26, close to gold's June 2013 low, it was 66.2.
In declines, silver falls faster than gold, and the ratio rises. Near real bottoms, the ratio starts to fall while gold is still close to its lows, and the mining stocks lead. We're not seeing this yet.
Gold's own chart points in the same direction.
Gold breaks lower, as in 2013
On September 25, when gold futures traded near $4,320, I wrote that the implications of gold's steady, back-and-forth decline were "the same as they were in the first quarter of 2013: extremely bearish for the medium term, with the back-and-forth phase as the setup and the breakdown as the event." My subscribers were warned and prepared in advance.
The breakdown came. On October 30, gold closed below its 2026 lows, on Thursday, it moved below its October 30 low, and today, it moved to new 2026 lows. Since September 25, gold has declined by about 10 percent.
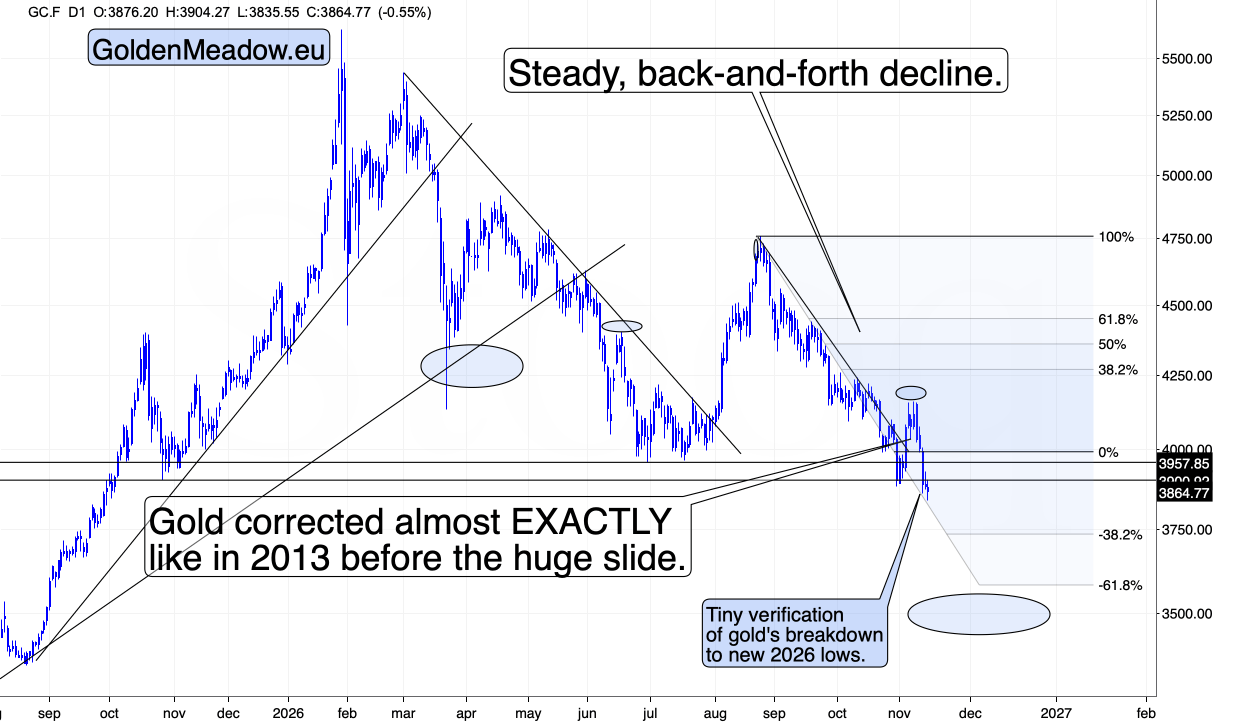
In 2013, in the middle of the gold bear market that started in 2011, gold moved below its pre-rebound low on April 3, closed below it on April 4, rebounded for three sessions, and crashed from April 12. This year, gold moved below its October 30 low on Thursday, paused for one session, and moved to new lows today. The moves are faster than in 2013, as they have been since the August top.
The driver is the price of money.
The Fed's hawks keep talking
Fed officials kept making hawkish comments. On Sunday, Kansas City Fed President Jeff Schmid said that inflation is still "running too hot" and that the Fed has "some work to do." A 25-basis-point hike on December 9 remains fully priced in the fed funds futures.
The 10-year Treasury yield closed at 5.15 percent on Friday, its highest close since October 14, and today, the USD Index futures moved up to 103.475, another 2026 high. Higher interest rates and a stronger dollar push gold lower, and the weekend's attacks in the Gulf didn't trigger a rally. When gold fails to rally on news that should help it, it's bearish information.
Where this leaves us
Silver topped close to my $120 target in January, and it's now below $48. Gold broke down from its back-and-forth decline, as in 2013, and it's at new 2026 lows. The gold-to-silver ratio is rising, the Fed's hawks keep talking about higher rates, and the USD Index futures are at new 2026 highs.
In my view, gold is likely to decline toward about $3,500, the target that I described in my November 2026 forecast. In today's Gold Trading Alert, I also covered the USD Index's next resistance, copper and FCX, the mining stocks, and what Wednesday's VIX futures expiry means for traders.
In January, silver's last burst of strength came right before the crash, and last Wednesday, it happened again.
Important note: the forecasts are up-to-date at the moment of their publication, we don’t guarantee updating them for free readers. We will, however, keep our premium subscribers updated at all times.
Want free follow-ups to the above article and details not available to 99%+ investors? Sign up to our free newsletter today!
Author
Przemyslaw Radomski, CFA
Gold Price Forecast
Przemyslaw Radomski, CFA (PR) is a precious metals investor and analyst who takes advantage of the emotionality on the markets, and invites you to do the same. His company, Sunshine Profits, publishes analytical software that any