Elliott Wave analysis: GDX correction concludes, anticipating minimum three-wave upside [Video]
![Elliott Wave analysis: GDX correction concludes, anticipating minimum three-wave upside [Video]](https://editorial.fxsstatic.com/images/i/gold-march-02.jpg)
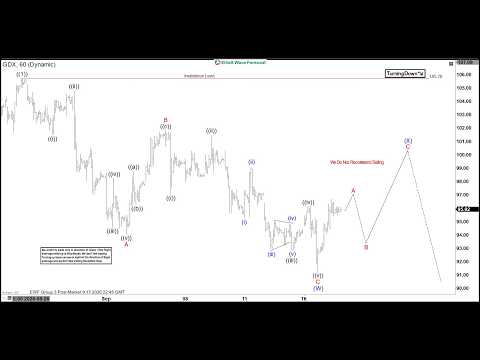
The short‑term Elliott Wave view in the Gold Miners ETF (GDX) shows that the rally from the July 17, 2026 low unfolded as a five‑wave impulse. This move ended wave ((1)) at $105.67, completing the initial bullish cycle. The ETF then entered a correction in wave ((2)), which is forming as a possible double three structure. From the peak of wave ((1)), wave A declined to $94. A rebound in wave B reached $101.83, followed by wave C, which dropped to $91.19. That decline completed wave (W) in higher degree.
The ETF is now correcting the cycle from the August 26, 2026 high in wave (X). This correction is unfolding as a zigzag structure and should precede another leg lower in wave (Y). As long as the pivot at $105.7 holds, the risk of further downside remains. Another leg lower cannot be ruled out if the double three structure continues.
Gold miners ETF 60 minute Elliott Wave chart
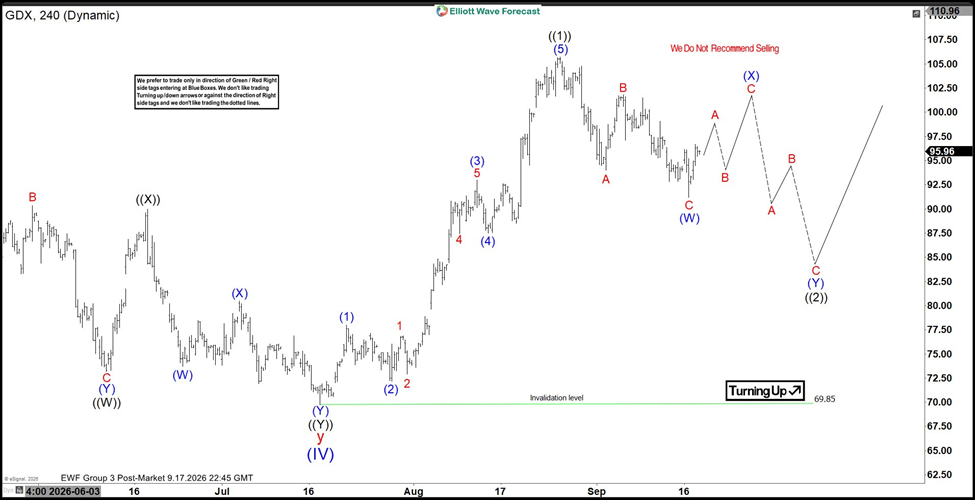
Despite near‑term weakness, the broader trend remains bullish. An alternate view suggests the correction against the July 17 low may have already ended as a simple three‑swing zigzag. If this scenario is correct, the ETF is positioned to resume its advance and break to new highs. This framework highlights two paths. The primary view favors additional consolidation before the next rally. The alternate view points to immediate strength and continuation of the larger bullish trend.
GDX Elliott Wave video
Author

Elliott Wave Forecast Team
ElliottWave-Forecast.com
















