Crypto Today: Bitcoin, Ethereum, XRP stall after US CPI-driven mild rally
- Bitcoin’s rebound following softer-than-expected US CPI data stops at around $65,000.
- Ethereum stalls below the $1,900 immediate resistance despite ETF inflows returning.
- XRP holds above the reclaimed $1.10 support, but its upside remains capped by falling major moving averages.

The cryptocurrency market pauses on Wednesday, following a brief, macro-driven rally the previous day. Bitcoin (BTC) is consolidating above $64,500, signaling waning bullish momentum and increased profit-taking as sellers emerge.
Altcoins, including Ethereum (ETH) and Ripple (XRP), are mirroring BTC’s performance, with momentum fading after the short-lived rally. ETH is encountering resistance near $1,900, while XRP continues to defend the recently reclaimed $1.10 support level.
Weaker US CPI boosts investor interest
The Bureau of Labor Statistics (BLS) reported on Tuesday that the Consumer Price Index (CPI) declined by 0.4% in June on a seasonally-adjusted basis, marking the sharpest monthly decrease since April 2020.
This pullback brought the annual headline inflation rate down to 3.5% from 4.2% in May, a notable cooling that could influence risk sentiment and speculative flows in risk assets.
Core inflation, which excludes the more volatile food and energy prices, remained flat MoM, keeping the annual rate steady at 2.6%, down from 2.9% in May.
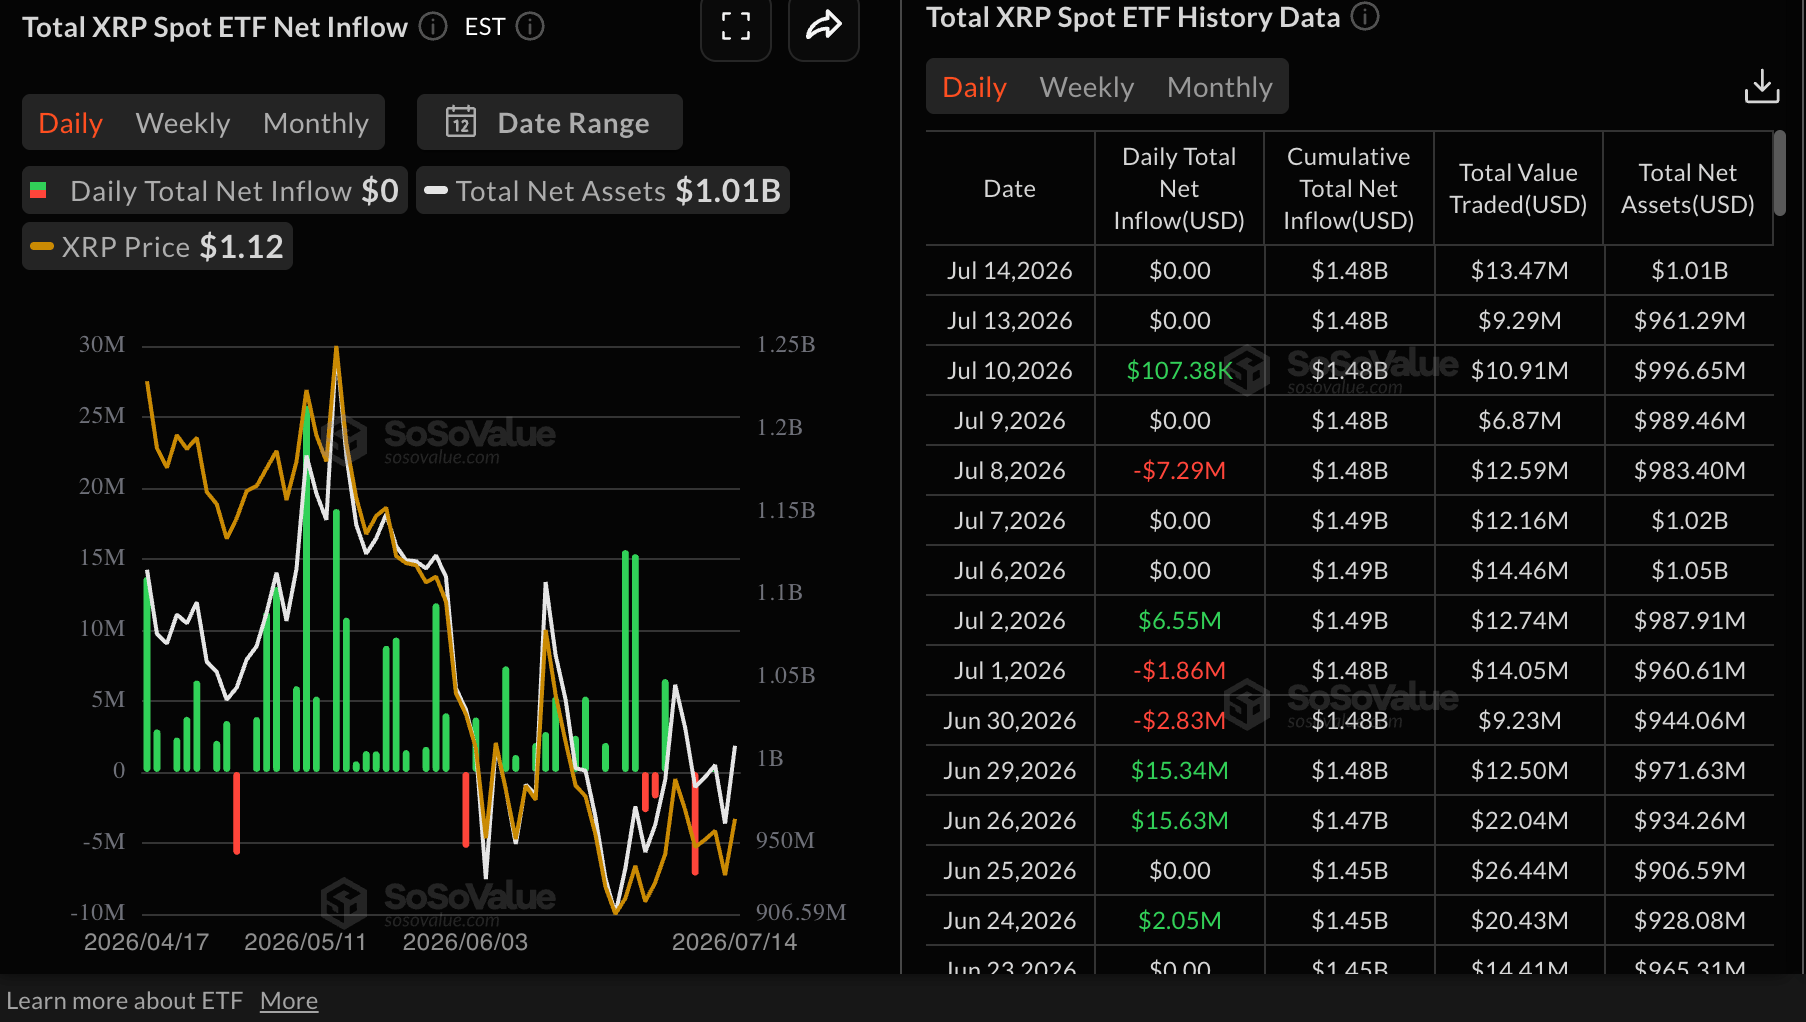
Market participants are currently pricing in an 86% probability that the Federal Reserve (Fed) will leave interest rates unchanged in the 3.30-3.75% range in the next review cycle on July 29. The lower-than-expected CPI data boosts risk-on sentiment, making risk assets attractive.
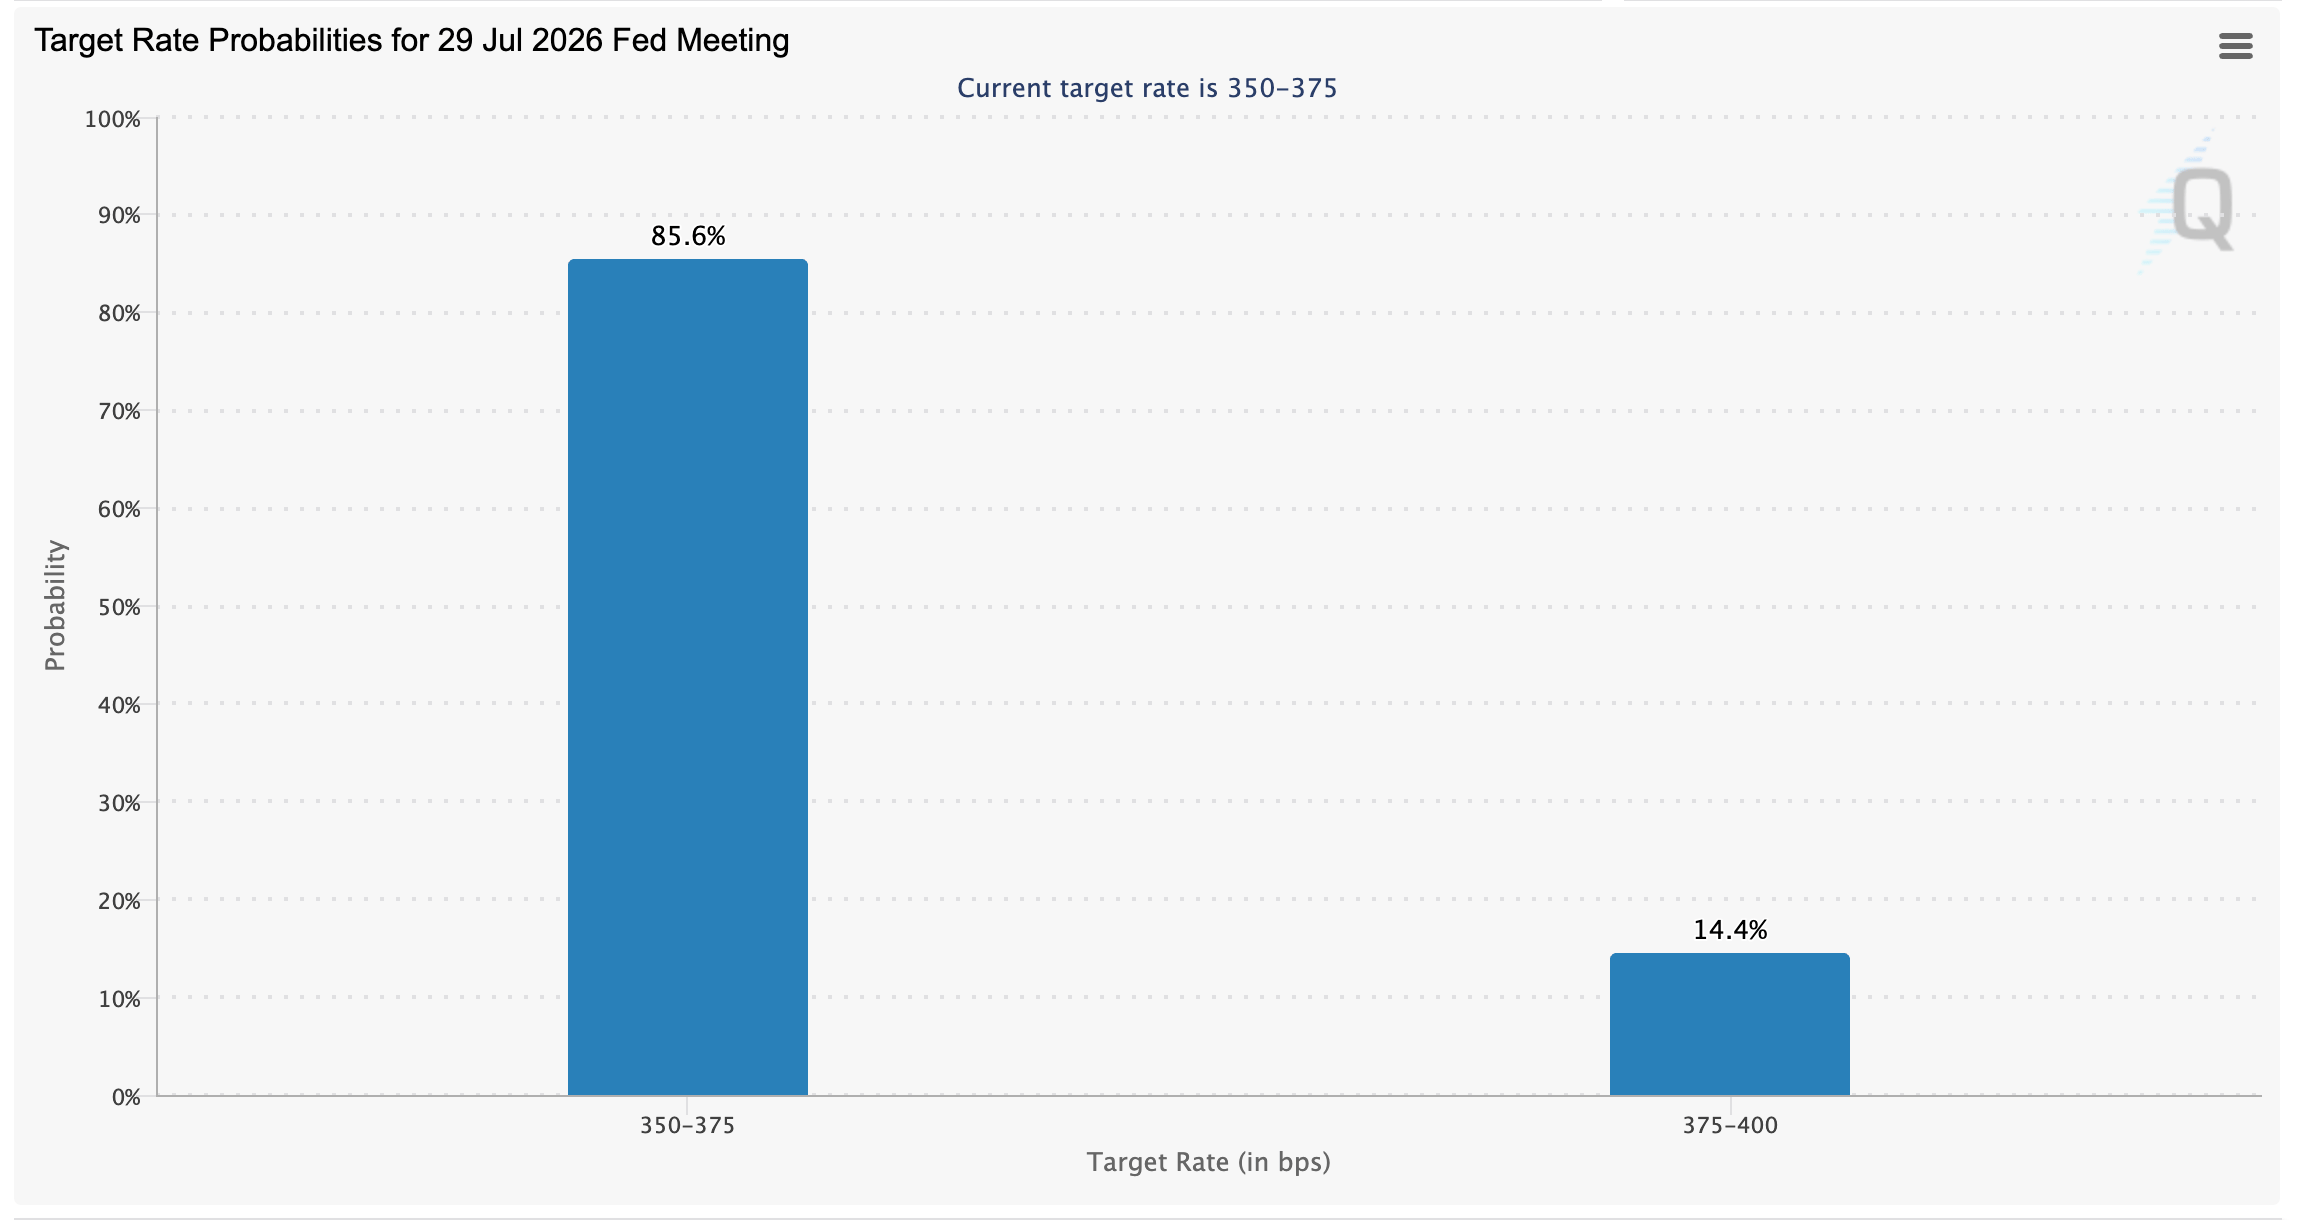
Meanwhile, Bitcoin spot Exchange-Trades Funds (ETFs) attracted inflows totaling $182 million on Tuesday, following massive outflows of $425 million the previous day. The return of inflows aligns with the improving sentiment in the broader cryptocurrency market. Moreover, cumulative inflows remain positive at $51 billion, with net assets under management at nearly $80 billion.
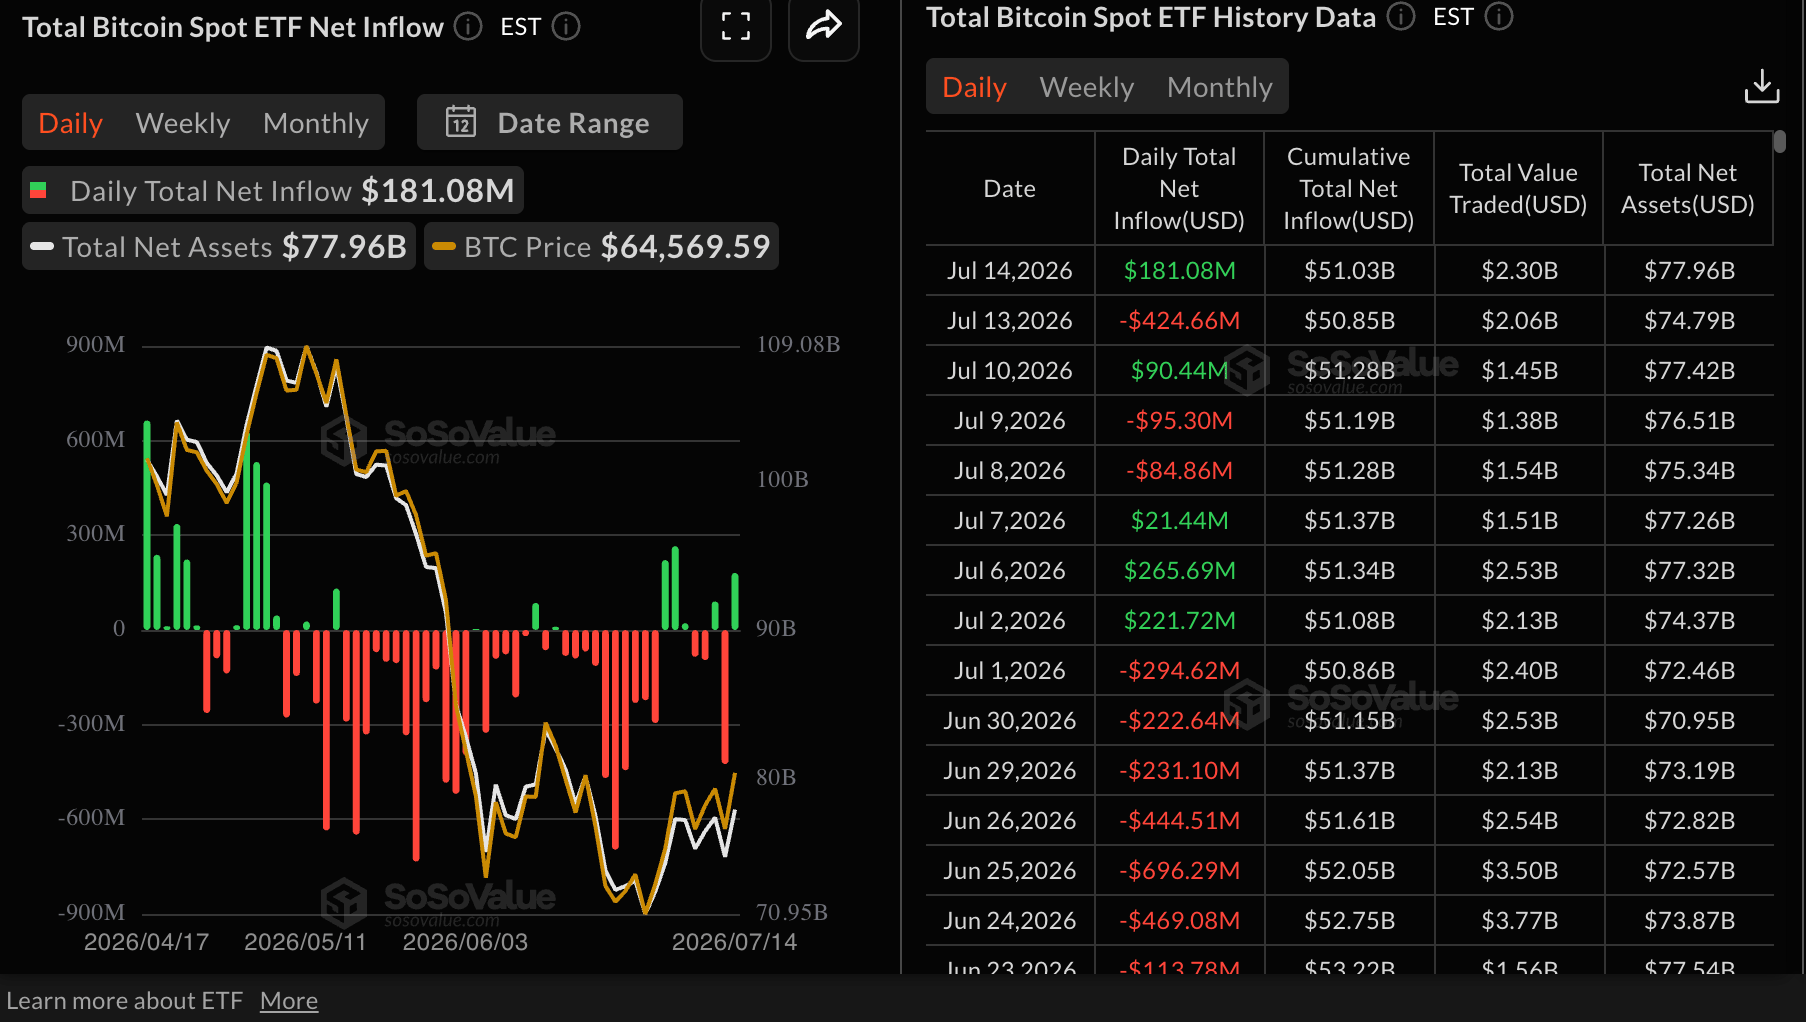
Ethereum spot ETFs also posted inflows totaling $58 million, marking a notable increase from $15 million in outflows the day before. Cumulative inflows remain positive at $11 billion, while net assets under management average $10 billion, suggesting a long-term positive outlook among institutional investors.
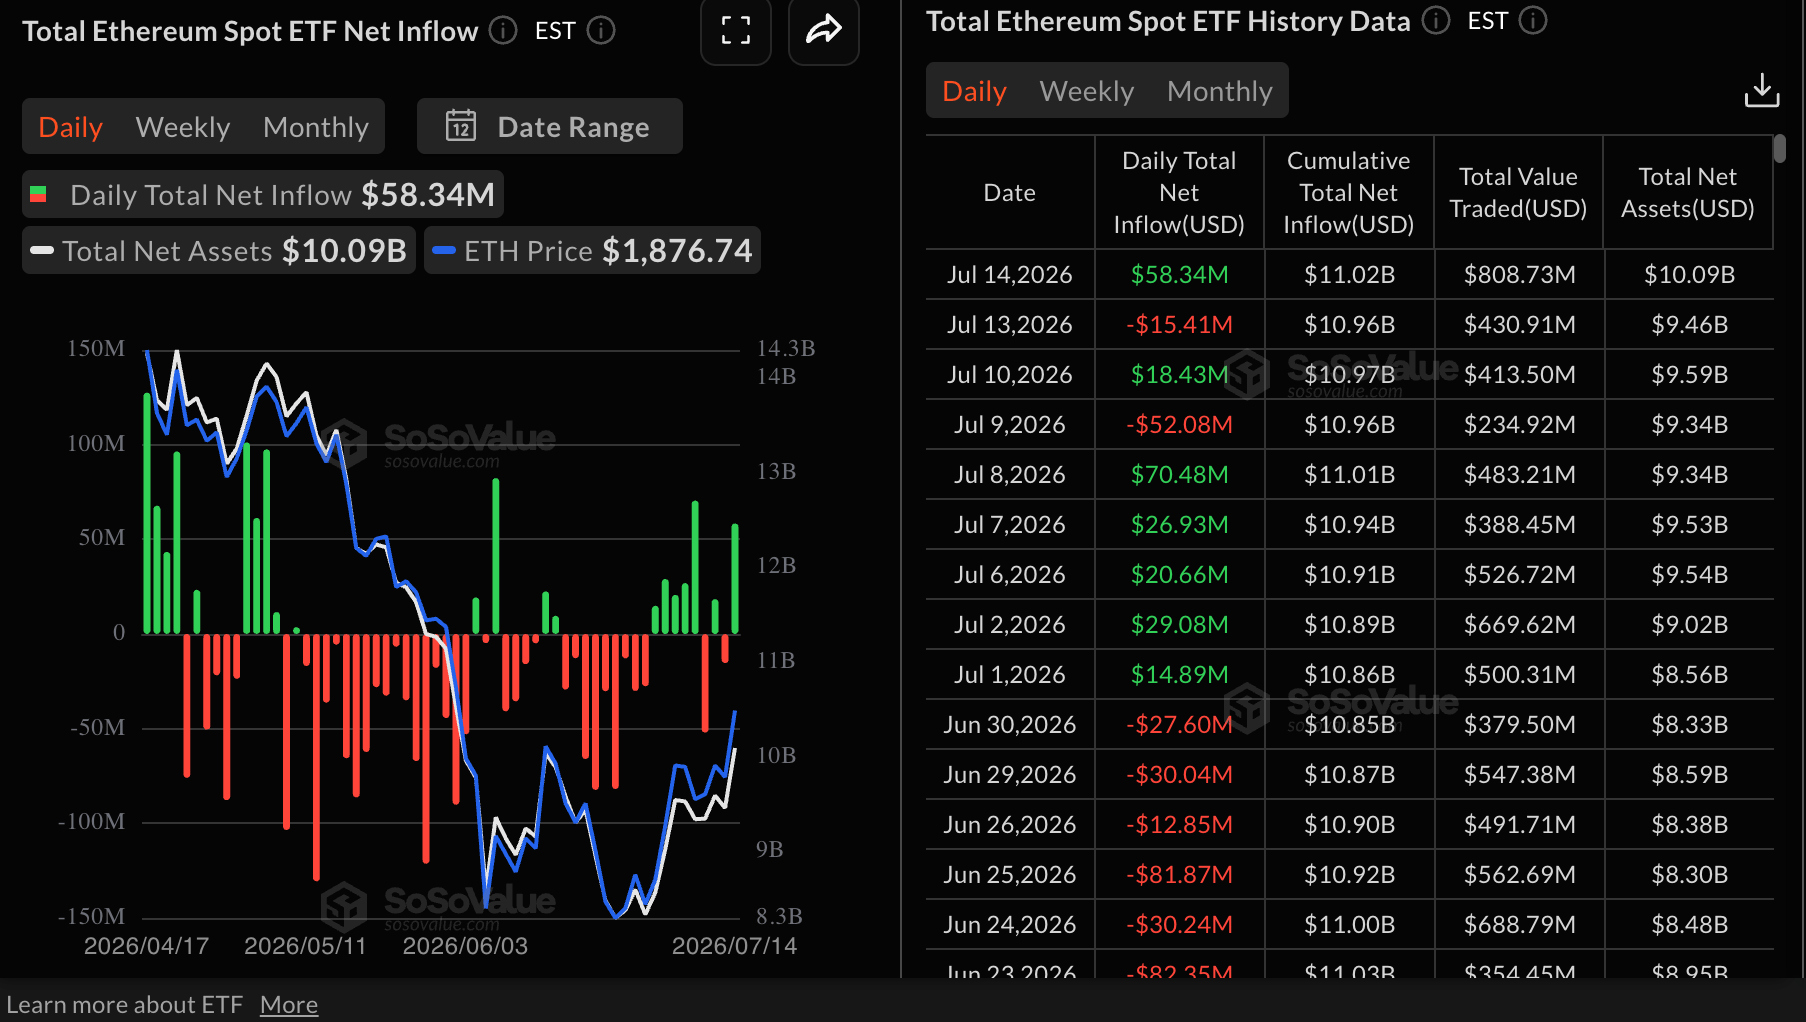
Institutional appetite for XRP spot ETFs continued to wane on Monday and Tuesday, evidenced by muted trading activity. This follows modest inflows of just $107,000 last Friday, while cumulative deposits remain at $1.48 billion and total net assets at $1 billion, underscoring relative steady demand from institutional players in the prevailing market environment.
Price analysis: Bitcoin pauses macro-driven rally
Bitcoin is trading around $64,643 following a sharp increase from Tuesday's low at $62,272. Still, the Crypto King holds beneath major Exponential Moving Averages (EMAs), which keeps the near-term bias capped despite improving momentum.
The Parabolic SAR at $61,825 and the previously broken downward trendline around $61,543 now underpin the market, while a Moving Average Convergence Divergence (MACD) reading above zero and a Relative Strength Index (RSI) at 55 hint at a constructive undertone that has yet to overcome overhead supply.
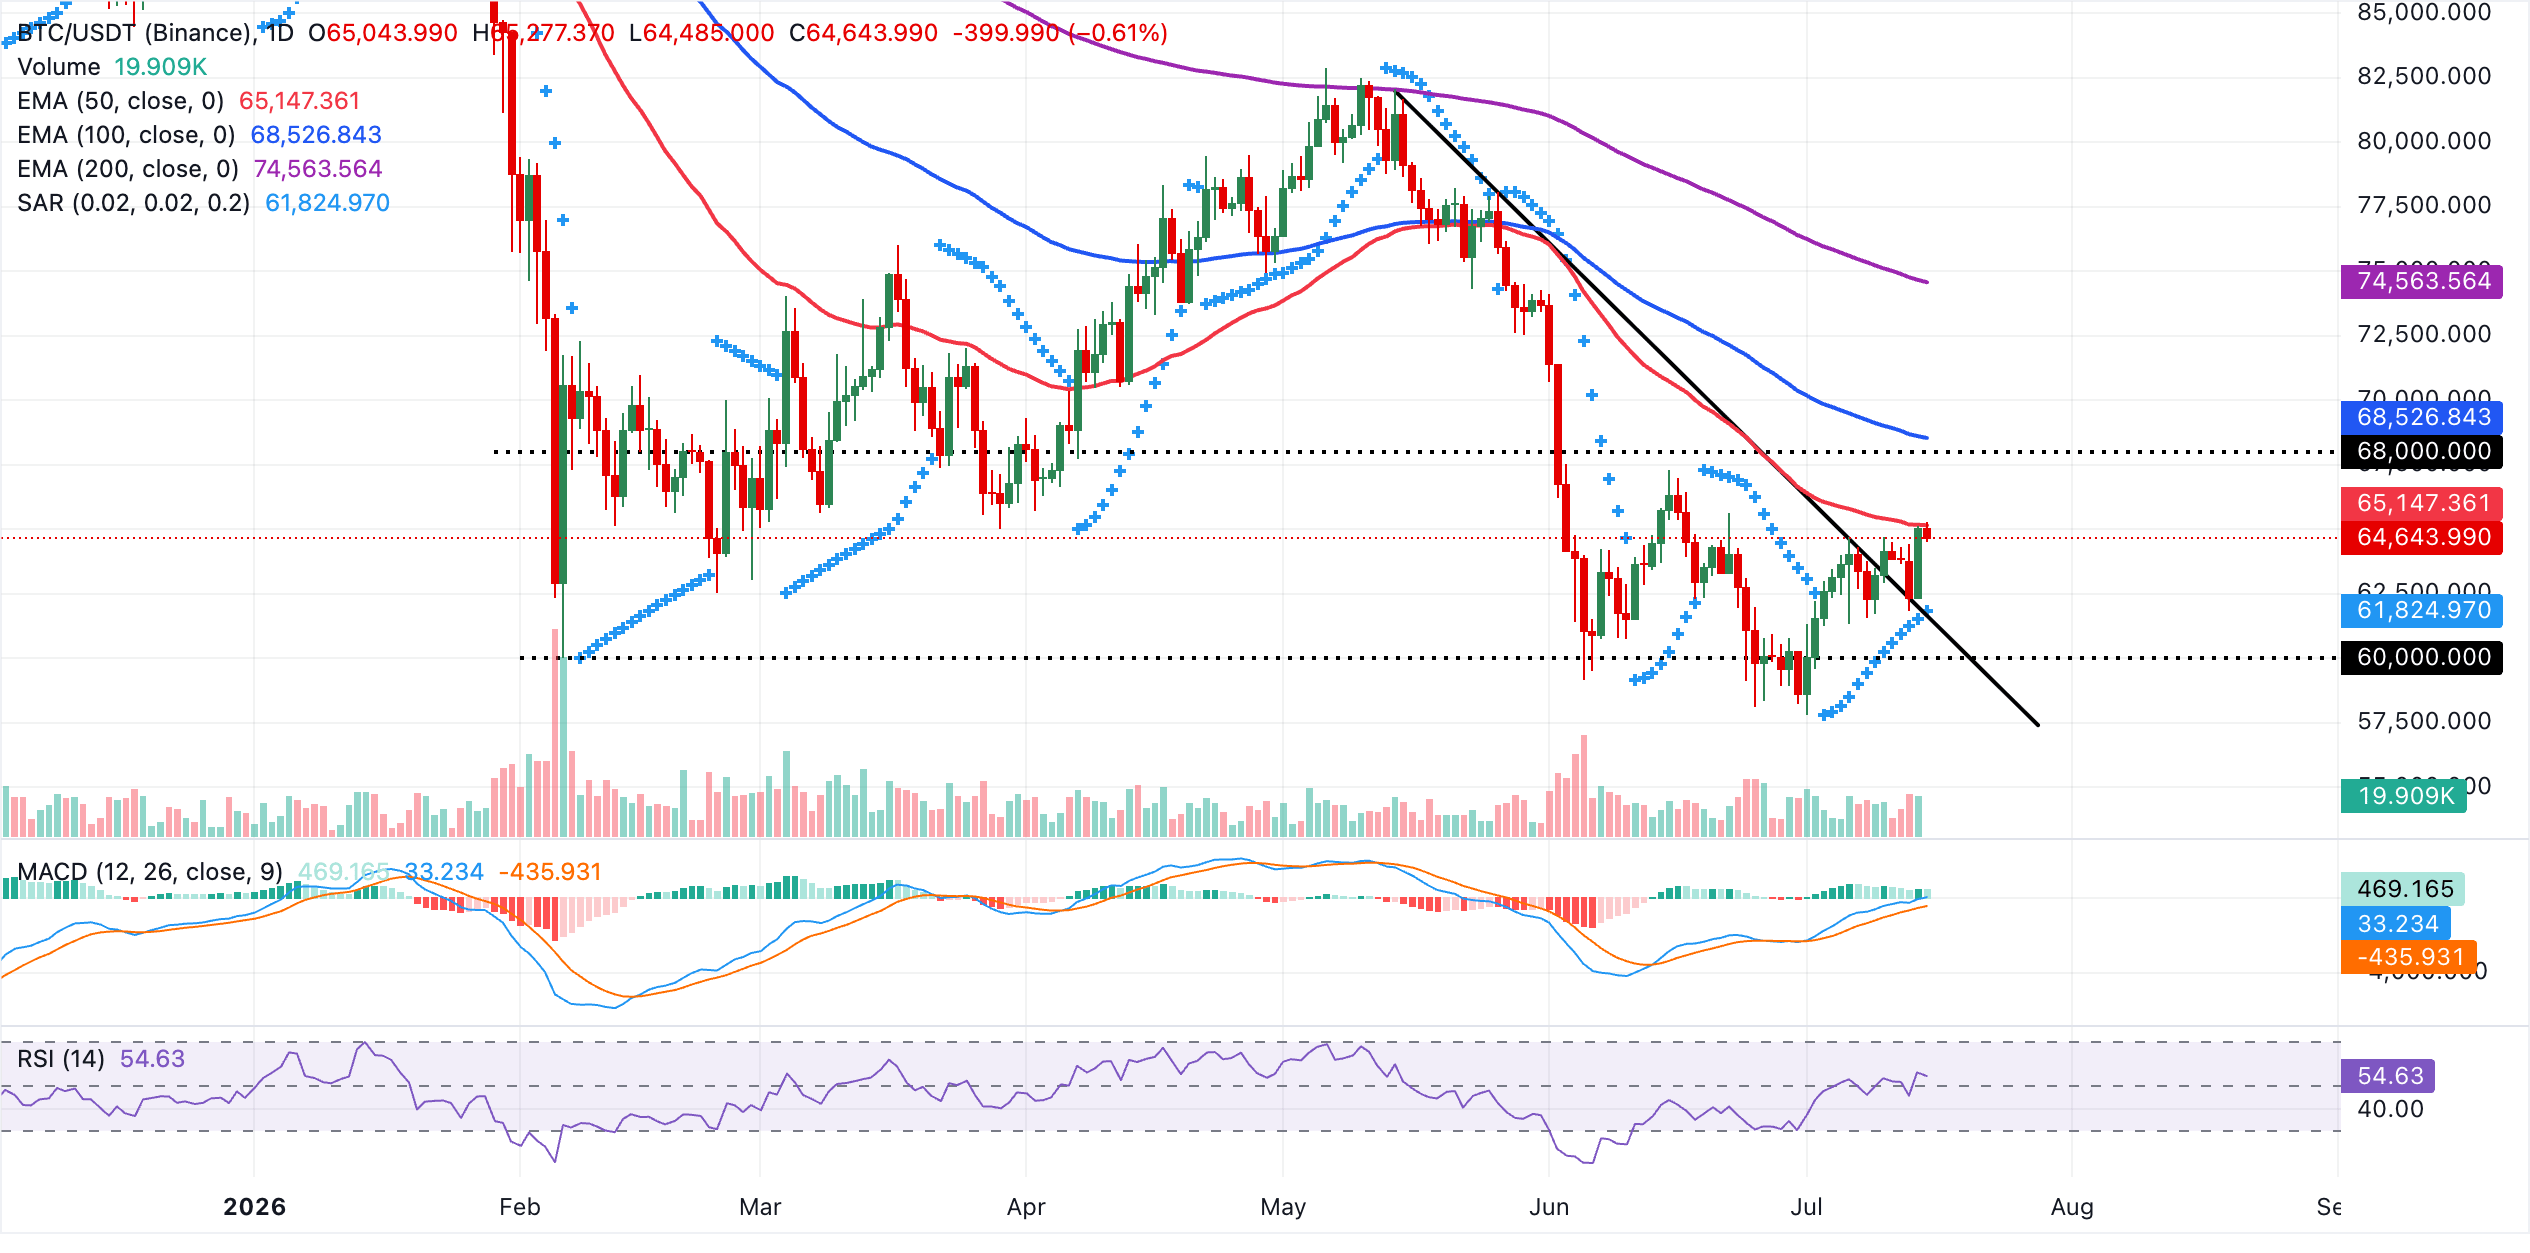
On the topside, initial resistance is seen at the 50-day EMA at $65,147, and a sustained break above this barrier would expose the next upside hurdle at the 100-day EMA near $68,527, ahead of the more strategic cap at the 200-day EMA around $74,564. On the downside, immediate support is aligned with the current price pivot zone, with the Parabolic SAR at $61,825 and the downtrend break level at $61,543 forming a dense demand area. A daily close back below this cluster would likely reassert bearish pressure and reopen the path toward deeper retracements.
Altcoins outlook: Ethereum and XRP hold higher short-term support
Ethereum trades at $1,875, maintaining a bullish near-term bias as it holds above the 50-day EMA at $1,806 and the Parabolic SAR support near $1,746. The pair is also trading above the former downward resistance trendline, which now acts as structural support around $1,642, while upside momentum is reinforced by the RSI at 62, staying in bullish territory but shy of overbought, and a positive MACD reading near 22, with the indicator suggesting sustained buying pressure.
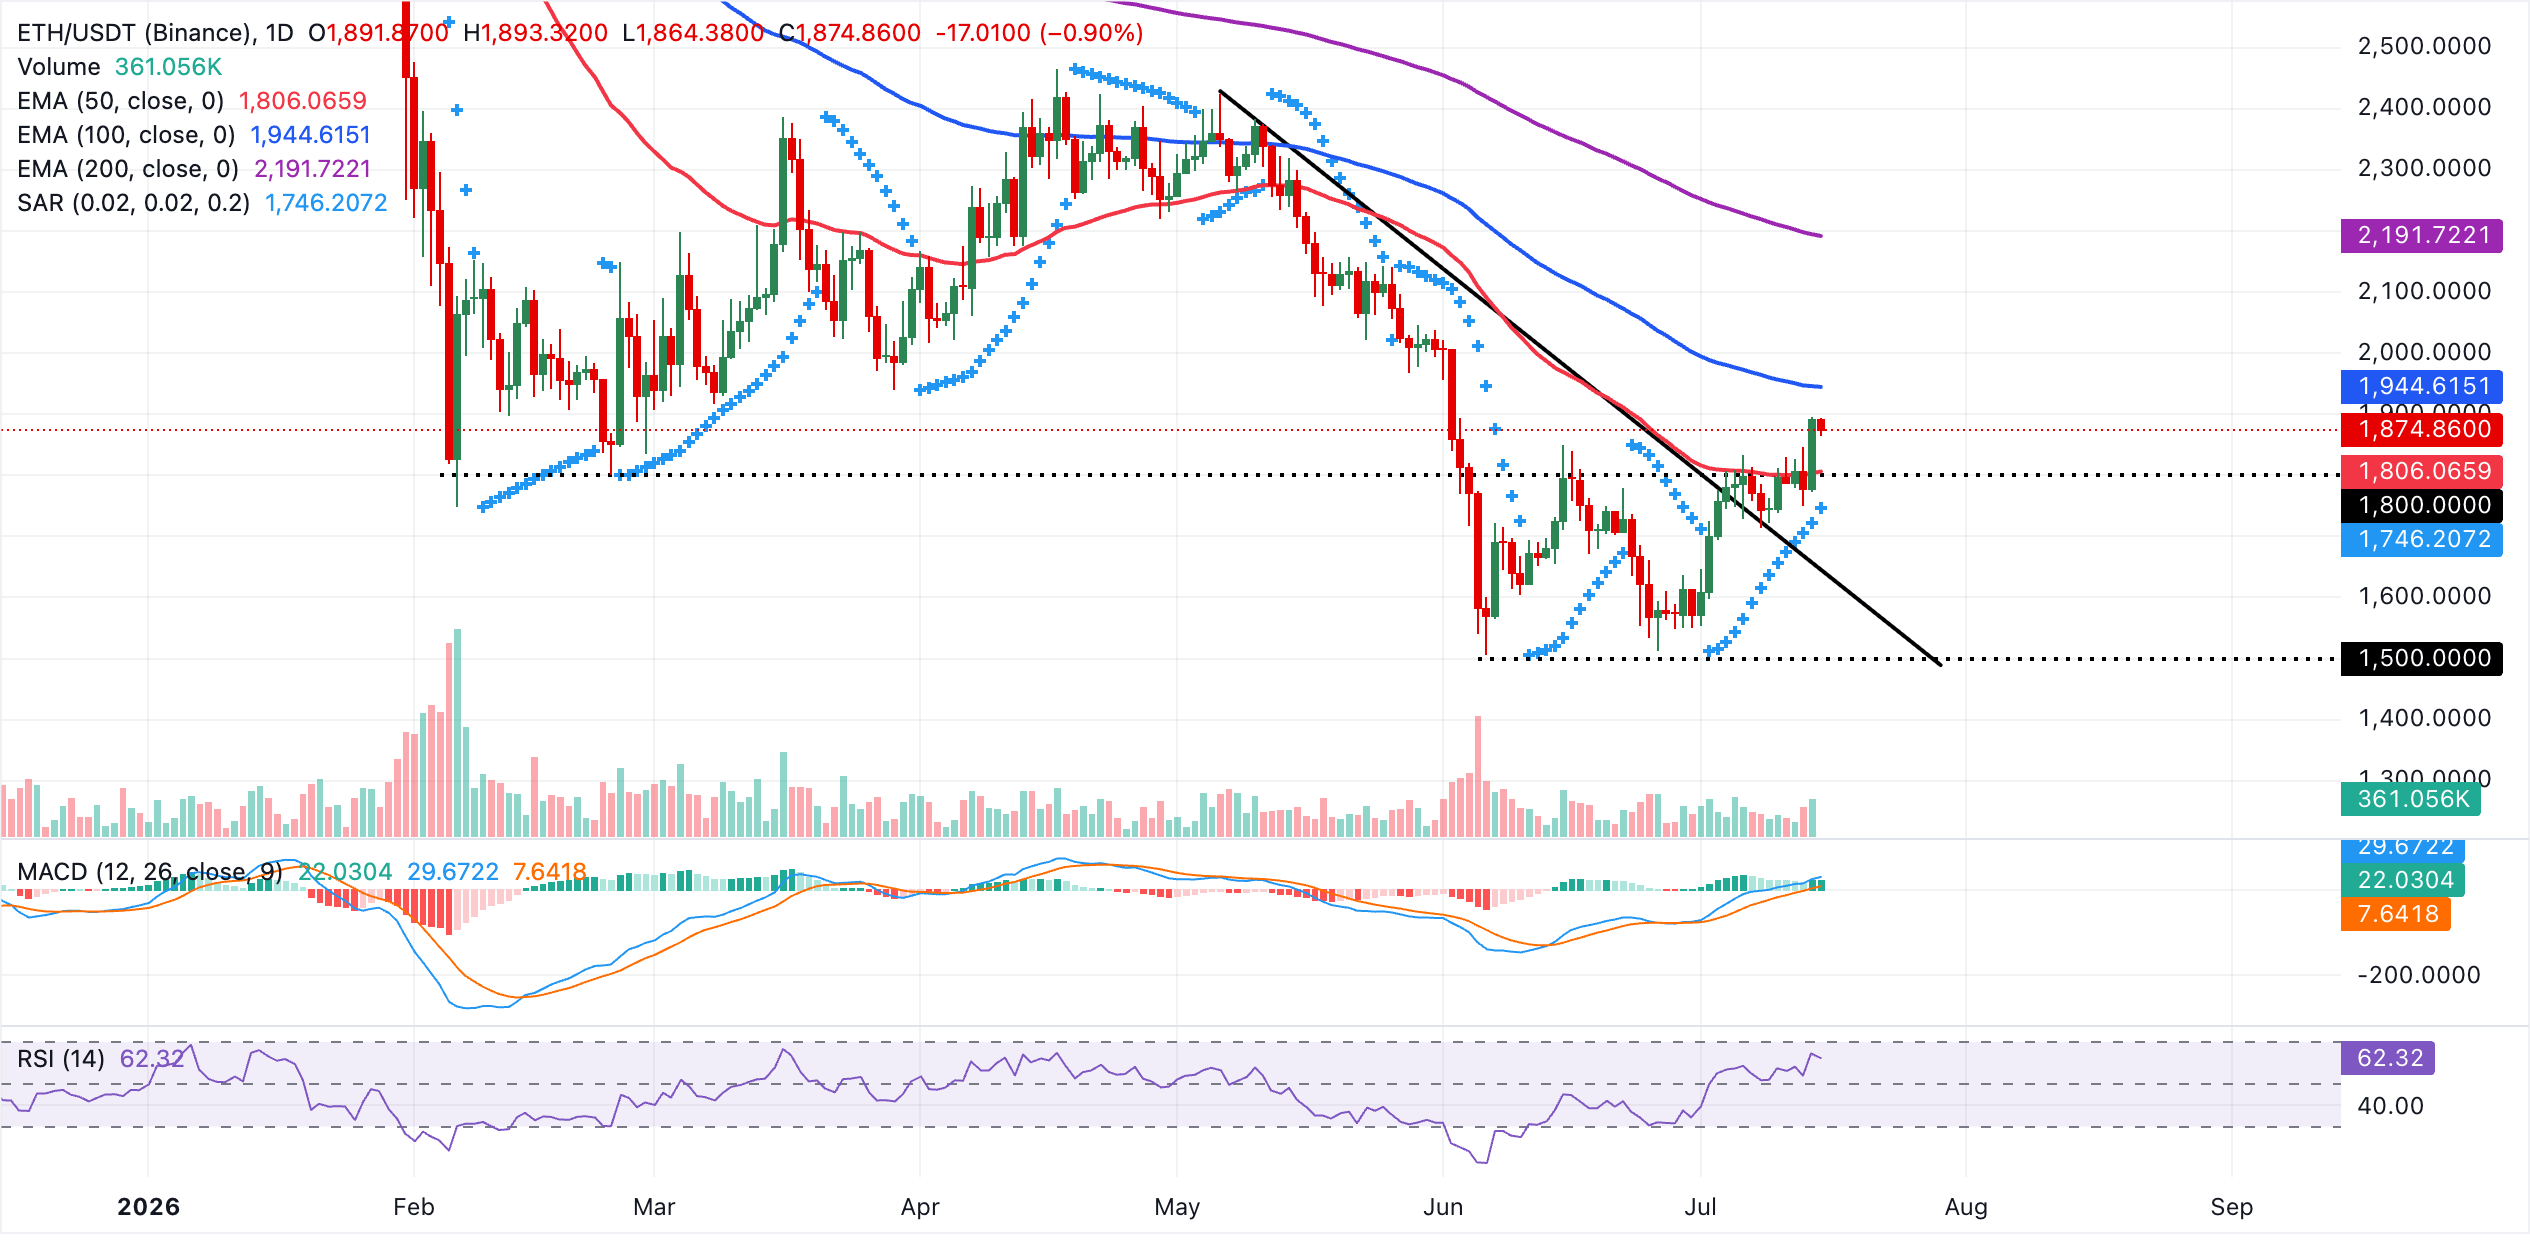
Initial resistance emerges at the 100-day EMA around $1,945, ahead of a more significant cap at the 200-day EMA near $2,192, and a sustained break above these moving averages would open the door to a broader recovery phase. On the flip side, immediate support is seen at the 50-day EMA at $1,806, followed by the Parabolic SAR level at $1,746, while the reclaimed downward trendline support around $1,642 marks a deeper floor that would need to hold to preserve the current bullish structure.
XRP, on the other hand, trades above $1.10, keeping a bearish near-term tone as price remains below the 50-day, 100-day and 200-day EMAs. The pair remains under the broken downtrend resistance reference at $1.11 suggesting the latest rebound is losing traction, even as the MACD indicator holds marginally above zero and the RSI hovers near a neutral 48, hinting at only modest directional pressure.
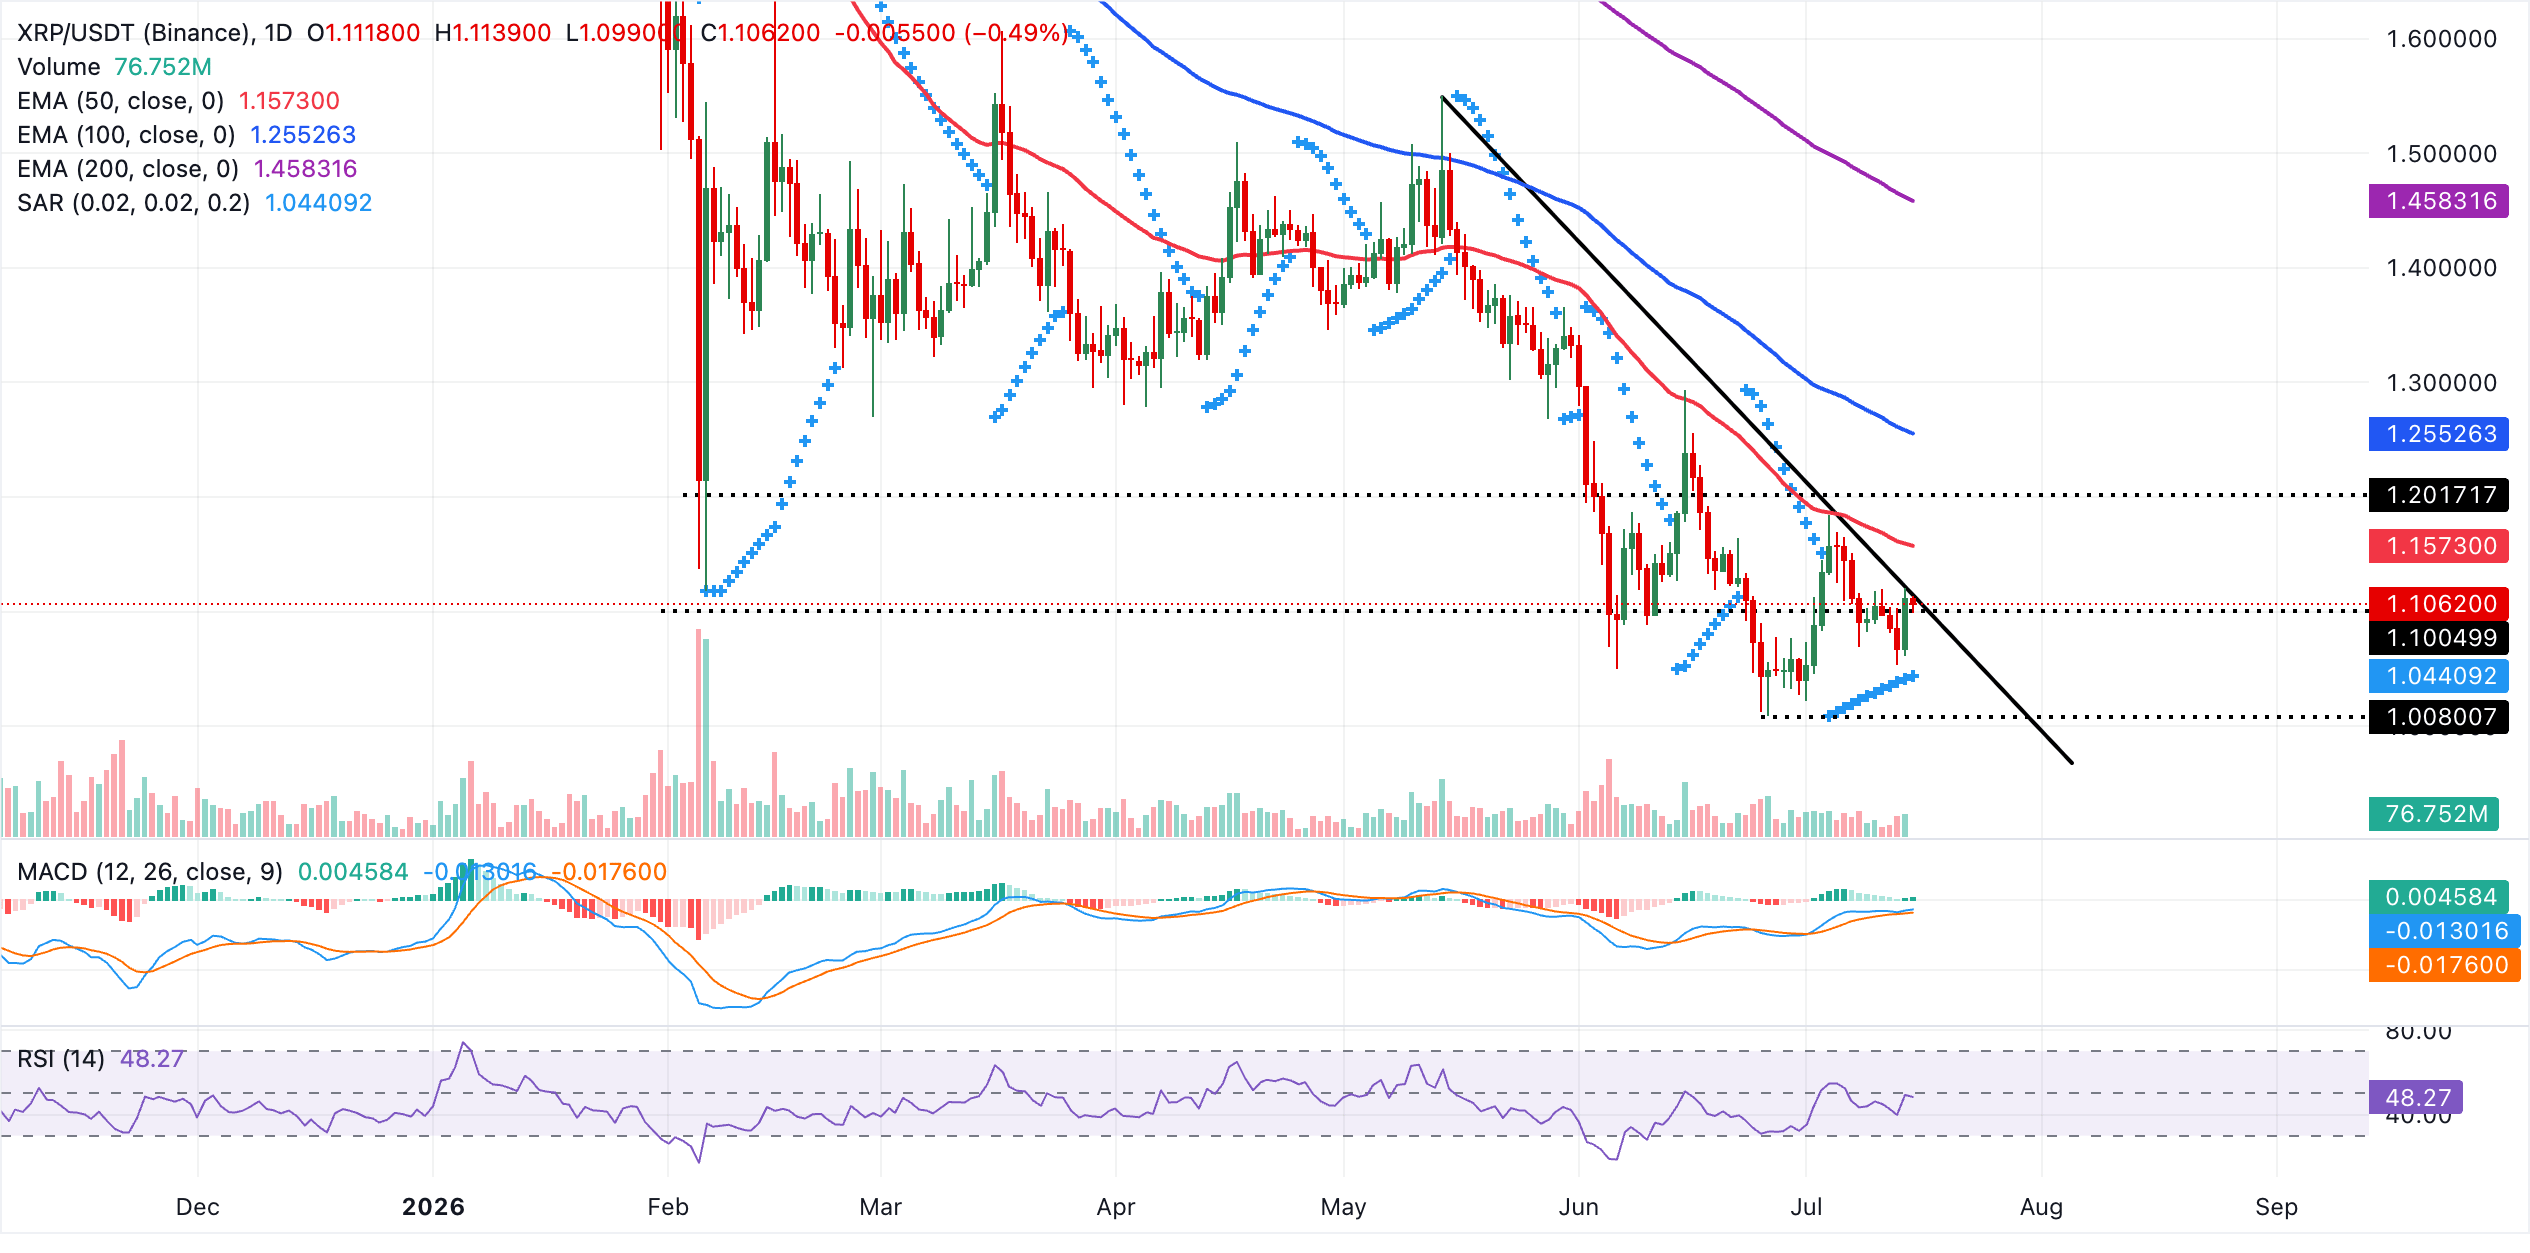
Initial resistance comes at the former trendline barrier around $1.11, ahead of a more meaningful cap at the 50-day EMA near $1.16, with the 100-day EMA at $1.26 and the distant 200-day EMA at $1.46 reinforcing the broader bearish structure. On the downside, the Parabolic SAR at $1.04 provides the next notable support level. A decisive break beneath this area would expose a deeper retracement phase, while holding above it could allow XRP to consolidate before attempting another test of the overhead EMAs.
(The technical analysis of this story was written with the help of an AI tool. Know more.)
Cryptocurrency prices FAQs
Token launches influence demand and adoption among market participants. Listings on crypto exchanges deepen the liquidity for an asset and add new participants to an asset’s network. This is typically bullish for a digital asset.
A hack is an event in which an attacker captures a large volume of the asset from a DeFi bridge or hot wallet of an exchange or any other crypto platform via exploits, bugs or other methods. The exploiter then transfers these tokens out of the exchange platforms to ultimately sell or swap the assets for other cryptocurrencies or stablecoins. Such events often involve an en masse panic triggering a sell-off in the affected assets.
Macroeconomic events like the US Federal Reserve’s decision on interest rates influence crypto assets mainly through the direct impact they have on the US Dollar. An increase in interest rate typically negatively influences Bitcoin and altcoin prices, and vice versa. If the US Dollar index declines, risk assets and associated leverage for trading gets cheaper, in turn driving crypto prices higher.
Halvings are typically considered bullish events as they slash the block reward in half for miners, constricting the supply of the asset. At consistent demand if the supply reduces, the asset’s price climbs.
Author

John Isige
FXStreet
John Isige is a seasoned cryptocurrency journalist and markets analyst committed to delivering high-quality, actionable insights tailored to traders, investors, and crypto enthusiasts. He enjoys deep dives into emerging Web3 tren