Could the stocks rally continue?

“For over 150 years scientists have tried to solve the mystery of a controversial cuneiform clay tablet that indicates the so-called Köfel’s impact event was observed in ancient times. The circular stone-cast tablet was recovered from the 650 BC underground library of King Ashurbanipal in Nineveh, Iraq in the late 19th century. Long thought to be an Assyrian tablet, computer analysis has matched it with the sky above Mesopotamia in 3300 BC and proves it to be of much more ancient Sumerian origin. The tablet is an “Astrolabe,” the earliest known astronomical instrument. It consists of a segmented, disk-shaped star chart with marked units of angle measure inscribed upon the rim.”
Recap 4/19 – Tuesday, the S&P opened flat and then rallied 60 handles into a 10:47 AM high. From that high, the S&P traded in a narrow 10 handle sideways trading culminating with a low at 2:19 PM. from that low, the S&P rallied 29 handles into a 3:52 PM high of the day. From that high, the S&P pulled back 15 handles into a 3;55 PM low. From that low, the S&P bounced 7 handles into the close.
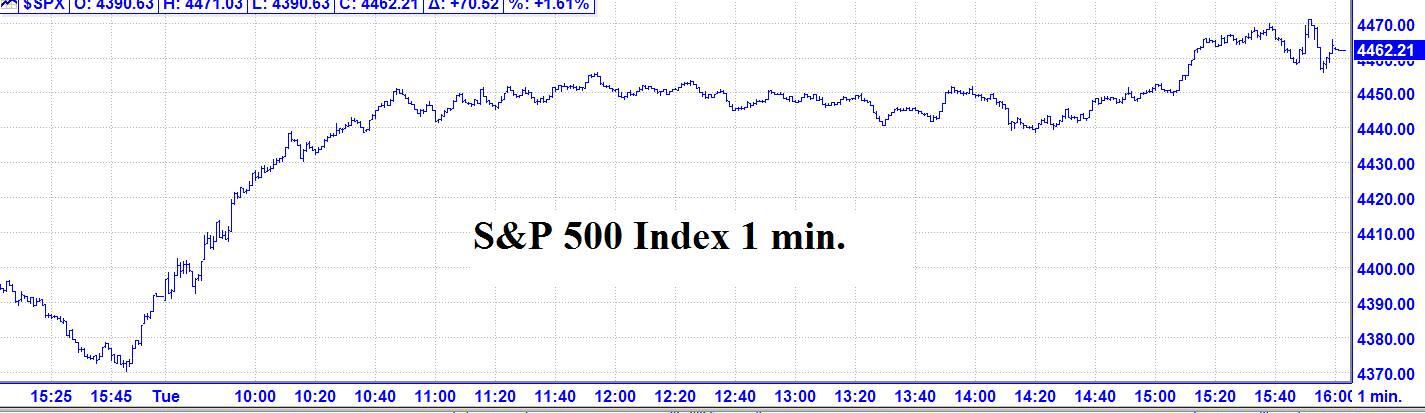
4/19 – The major indices had a very strong rally day to finish with the following closes; INDU + 499.51; S&P 500 + 70.52: and the NASDAQ Composite + 287.30.
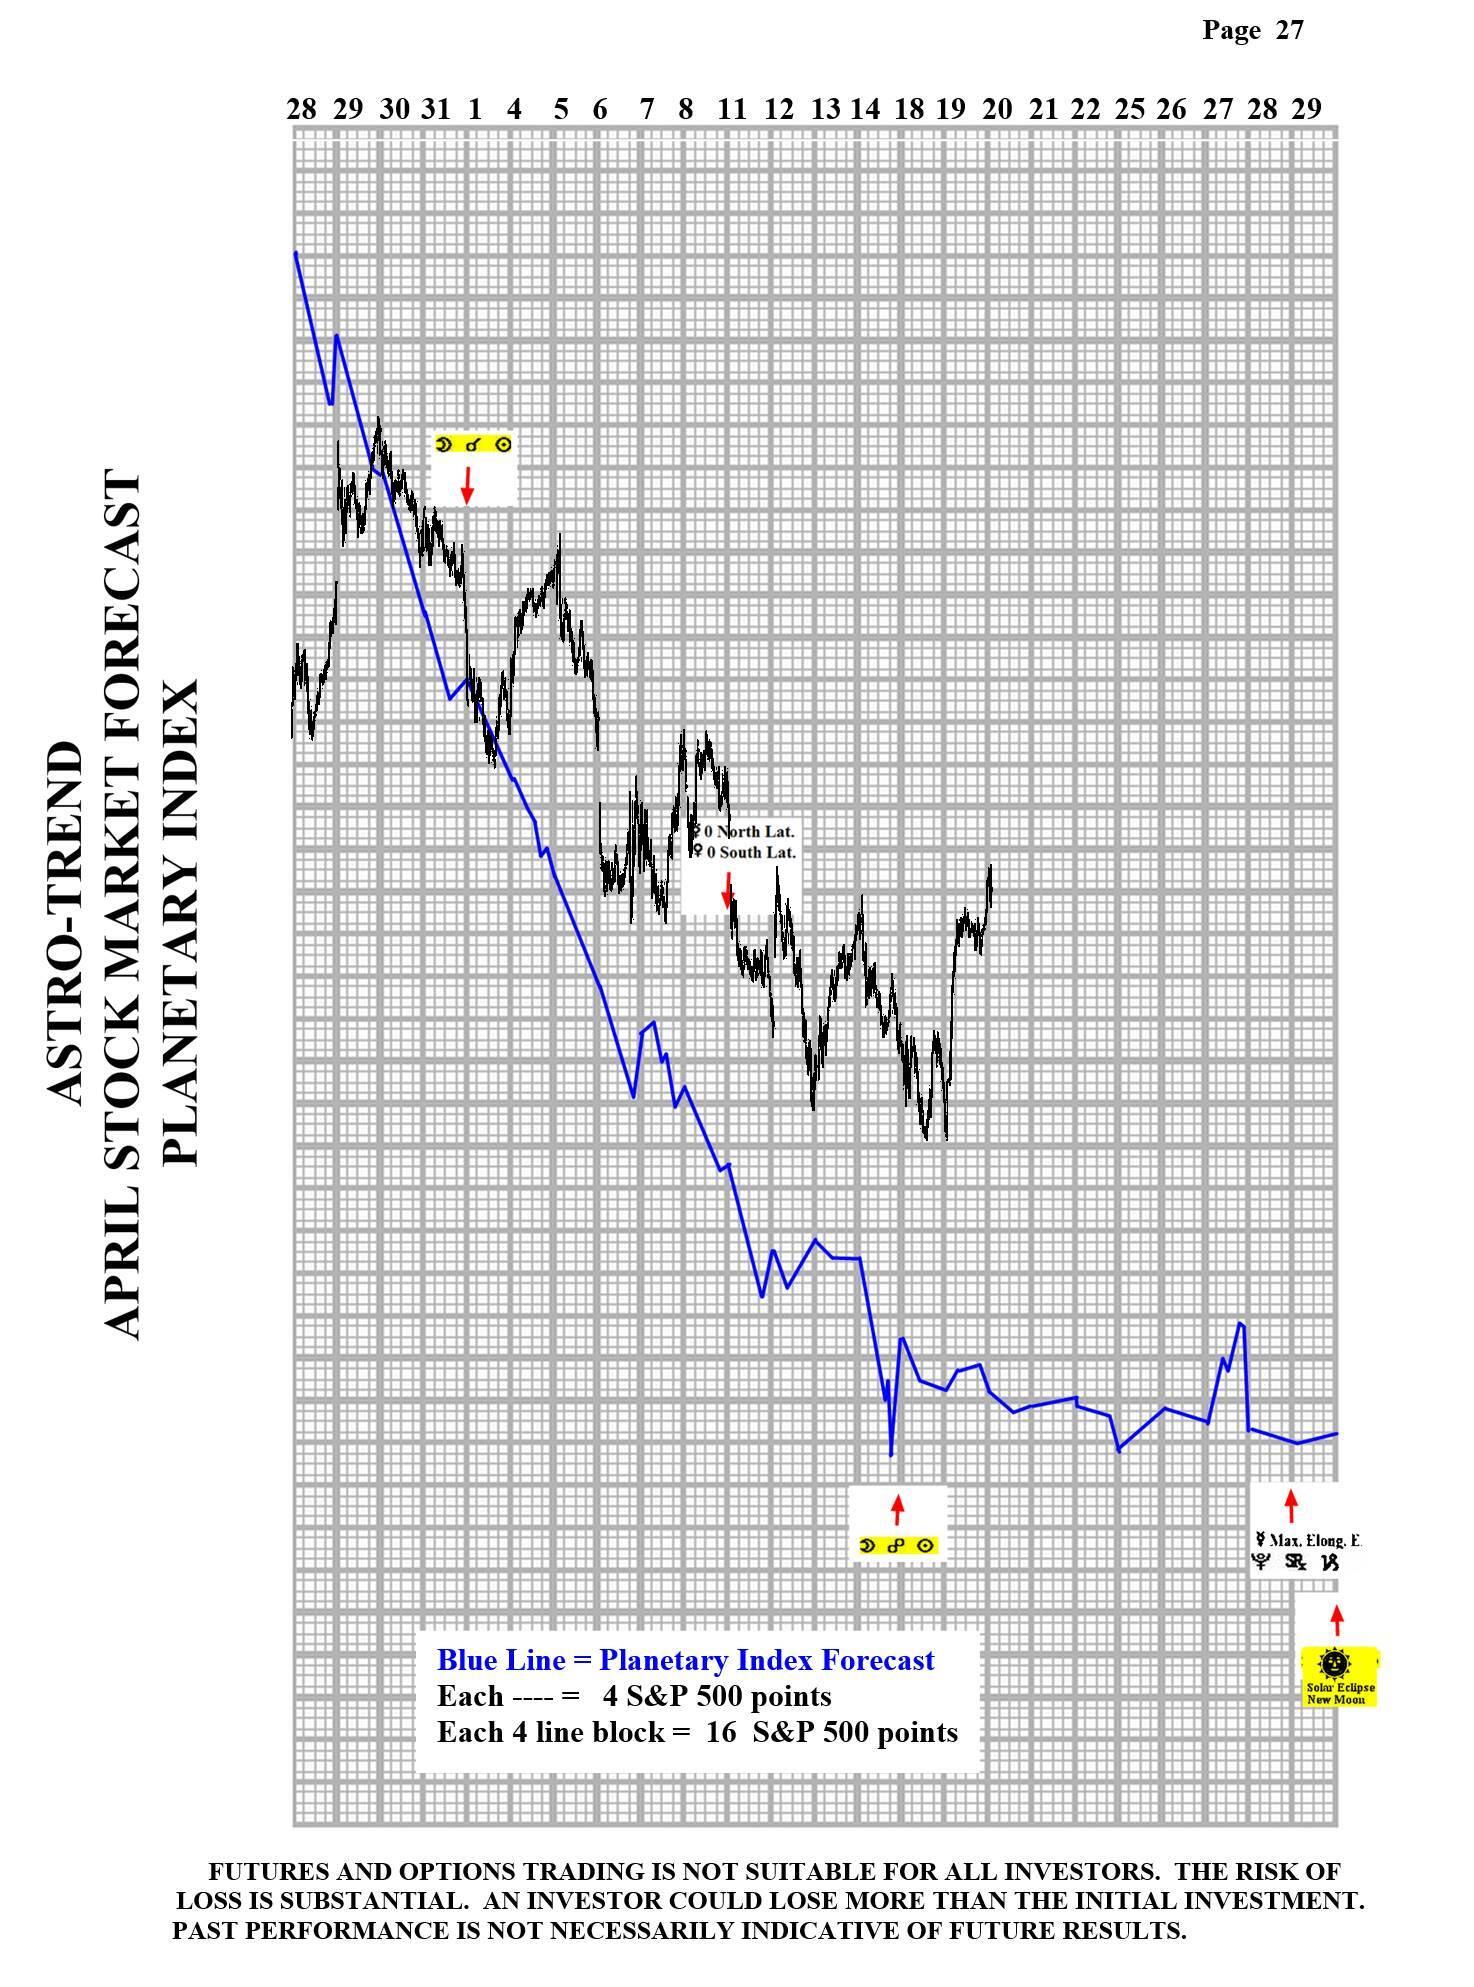
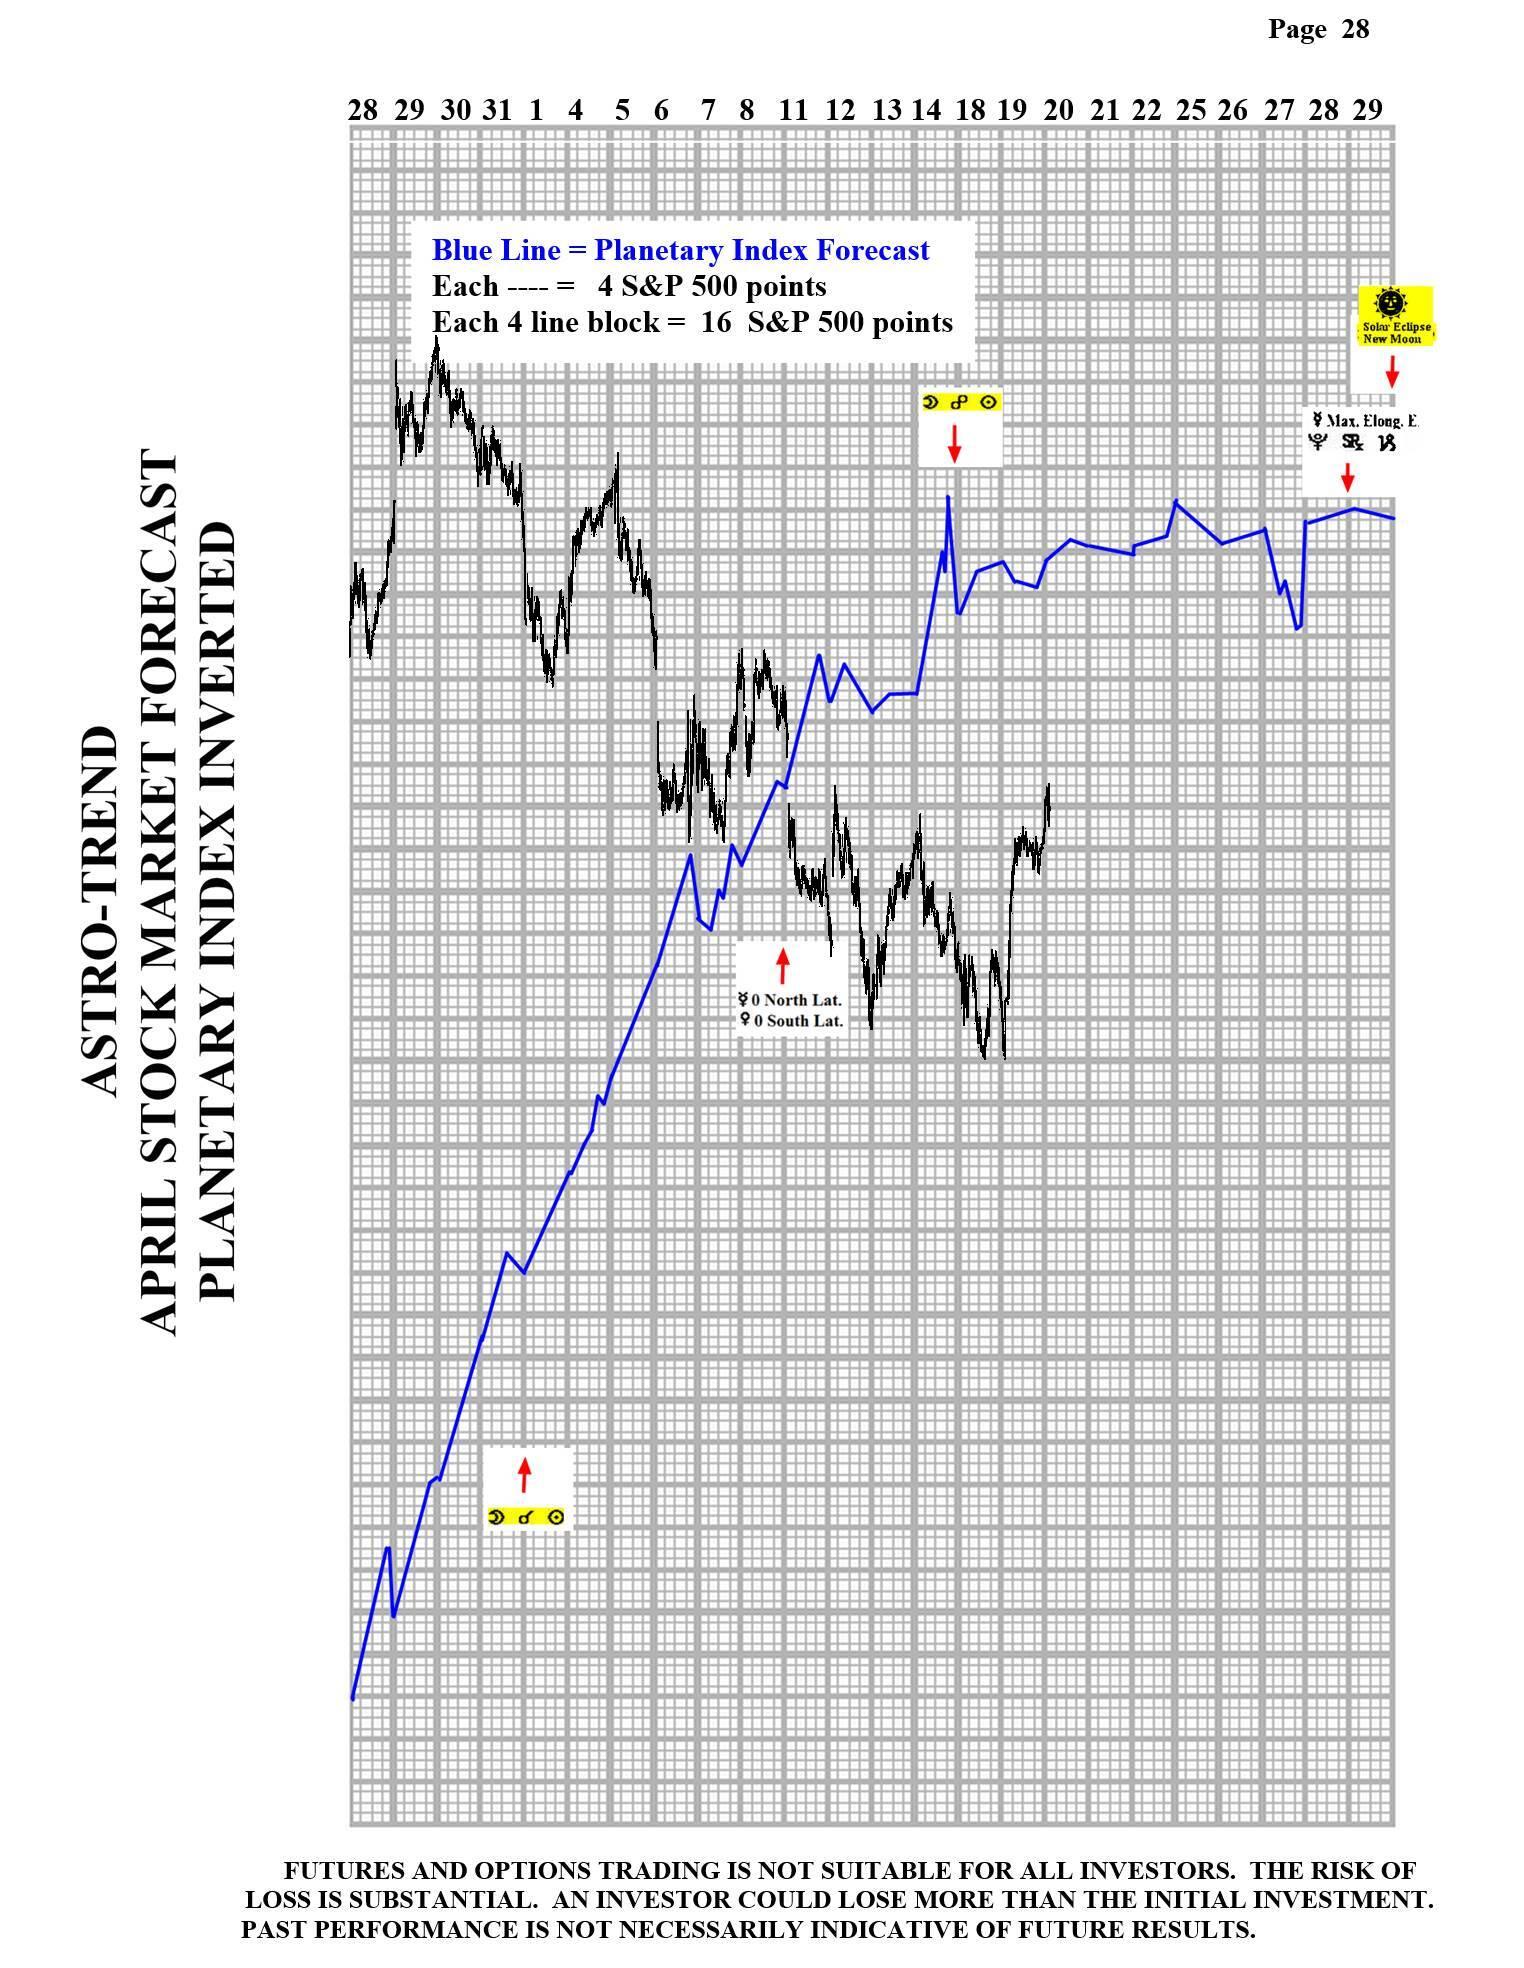
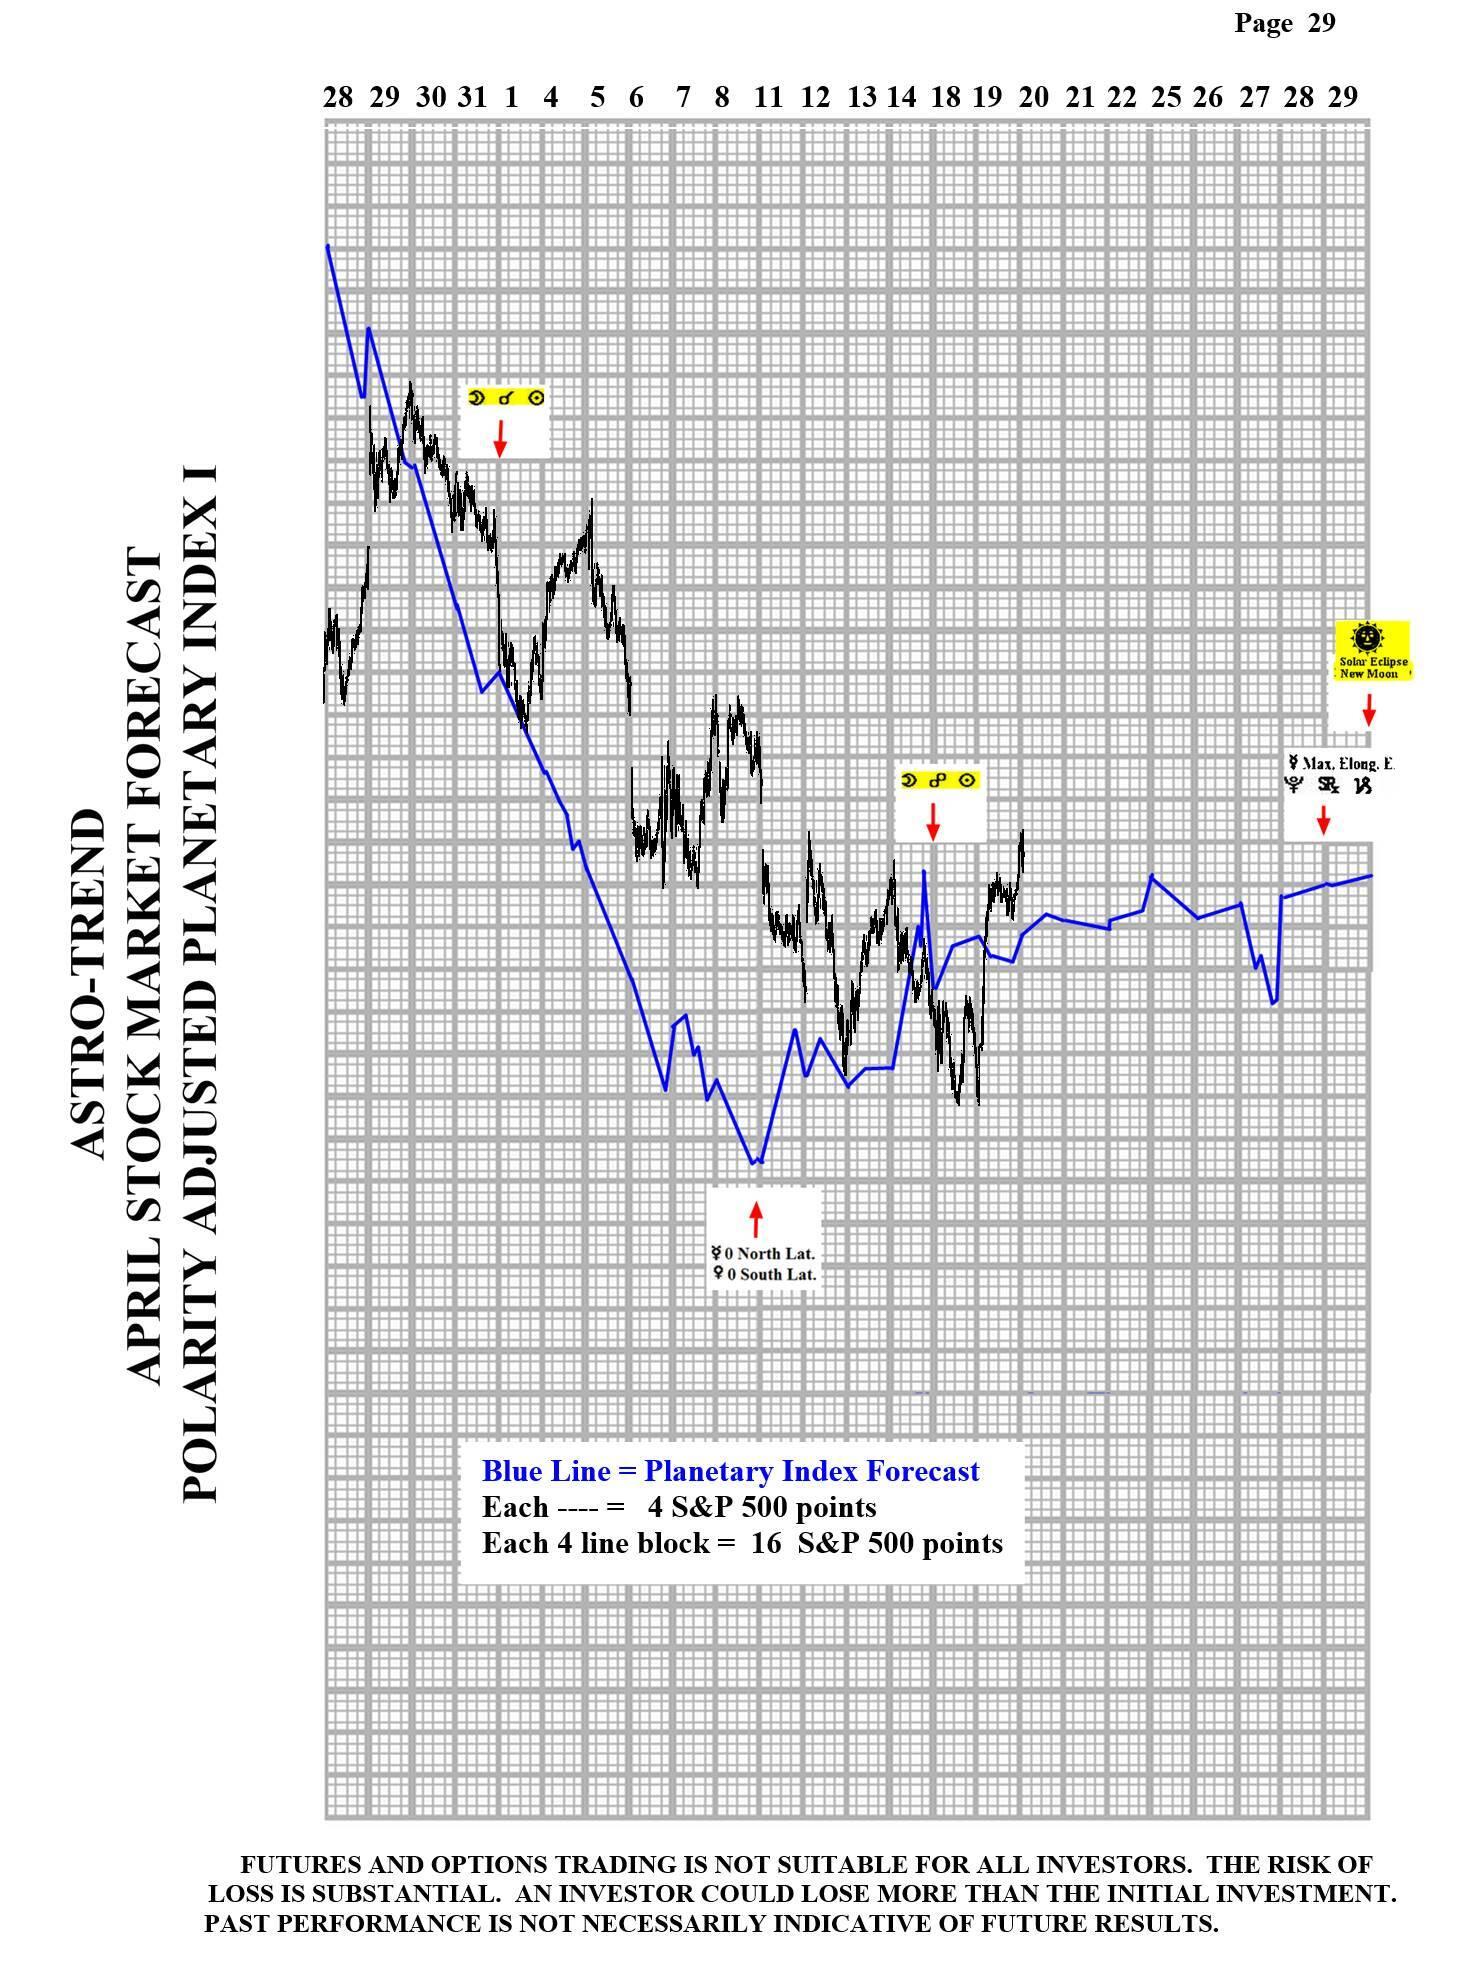
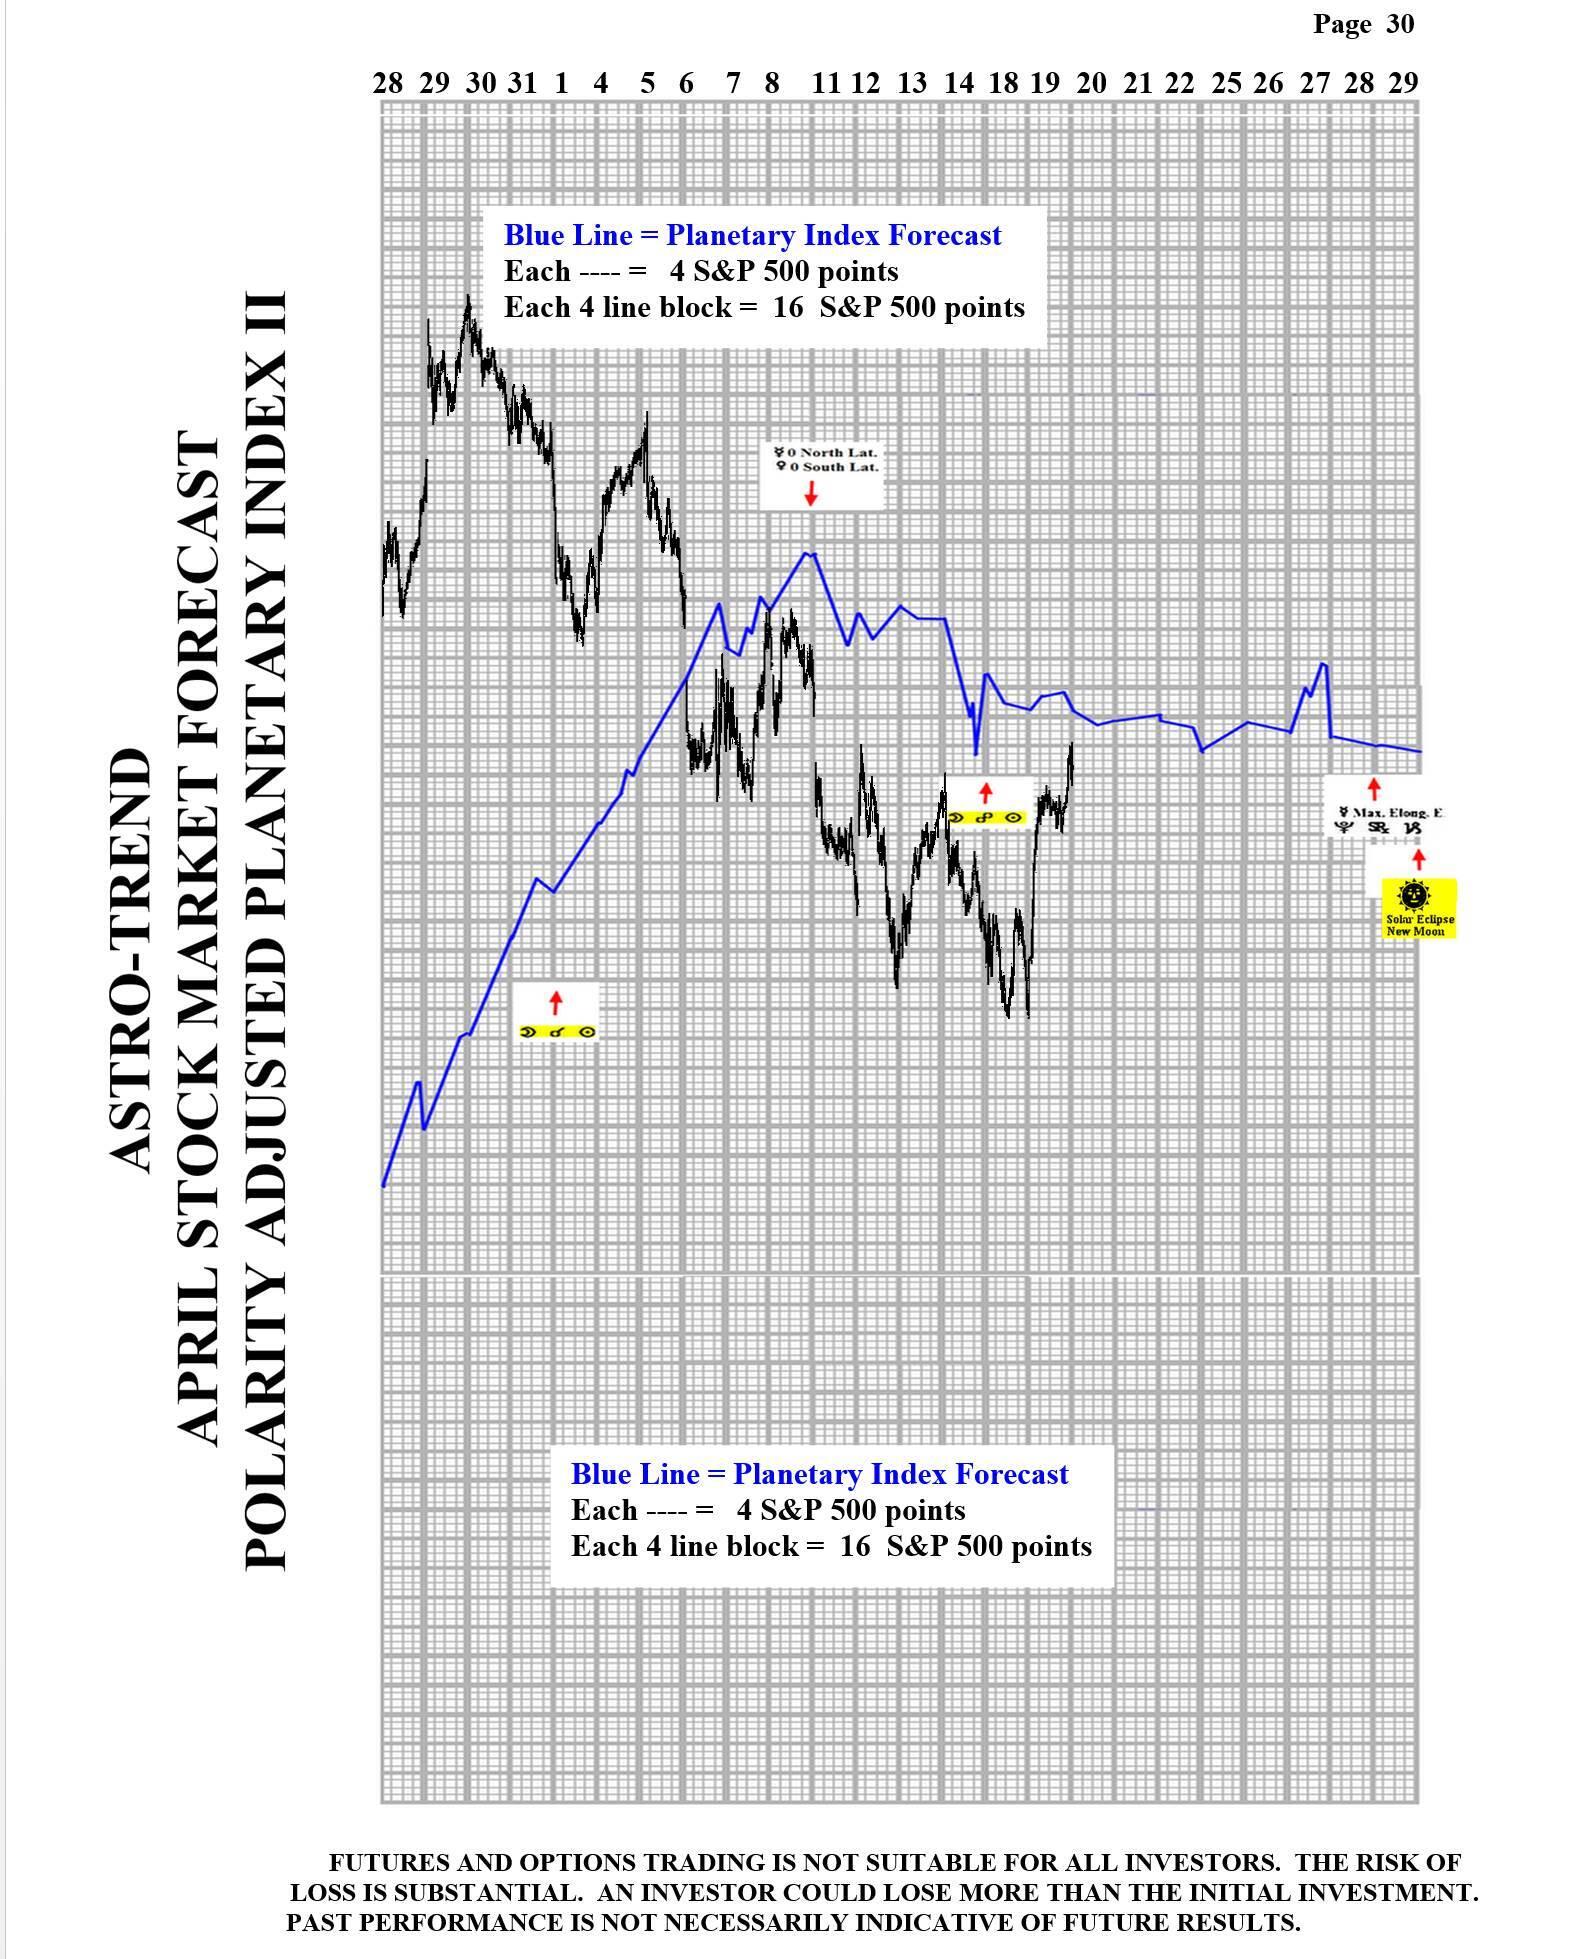
Looking ahead - Tuesday, as expected, we had a strong rally day. This rally could continue into the next change in tend window, 4/20 AC. However, if the market follows the Planetary Index models from either Page 29 or 30, the market is like to trade mostly Sideways for the rest of the month. Please see details below.
The Now Index is in the NEUTRAL ZONE.
Coming events
(Stocks potentially respond to all events).
4. A. 4/20 AC – Moon’s North Node 90 Saturn. Major change in trend Cattle, Copper, Coffee, Cotton, Silver.
B. 4/22 AC – Helio Mars enters Aquarius. Important change in trend Copper.
C. 4/22 AC – Jupiter Parallel US Moon. Major change in trend US Stocks, T-Bonds, US Dollar.
5. A. 4/27 AC – Neptune 120 US Mercury. Major change in trend US Stocks, T-Bonds, US Dollar.
B. 4/28 AC – Jupiter 60 US Pluto. Moderate change in trend US Stocks, T-Bonds, US Dollar.
C. 4/28 AC – Mercury Maximum Elongation East. Corn, Oats, Soybeans, Wheat.
D. 4/29 AM – Pluto in Capricorn turns Retrograde. Major change in trend Cocoa, Hogs, T-Bonds.
E. 4/29 AC – Solar Eclipse in Taurus. Major change in trend Financials, Grains, Precious Metals, Cattle, Cotton.
F. 4/29 AC – Jupiter 45 US MC. Moderate change in trend US Stocks, T-Bonds, US Dollar.
G. 5/04 AC – Saturn 150 US Mercury. Moderate change in trend US Stocks, T-Bonds, US Dollar.
H. 5/04 AC – Uranus 150 US Saturn. Moderate change in trend US Stocks, T-Bonds, US Dollar.
Stock market key dates
DJIA* – 4/26.
Fibonacci – 4/21, 4/29.
Astro – 4/25, 4/28, 4/29, 4/29 AC.
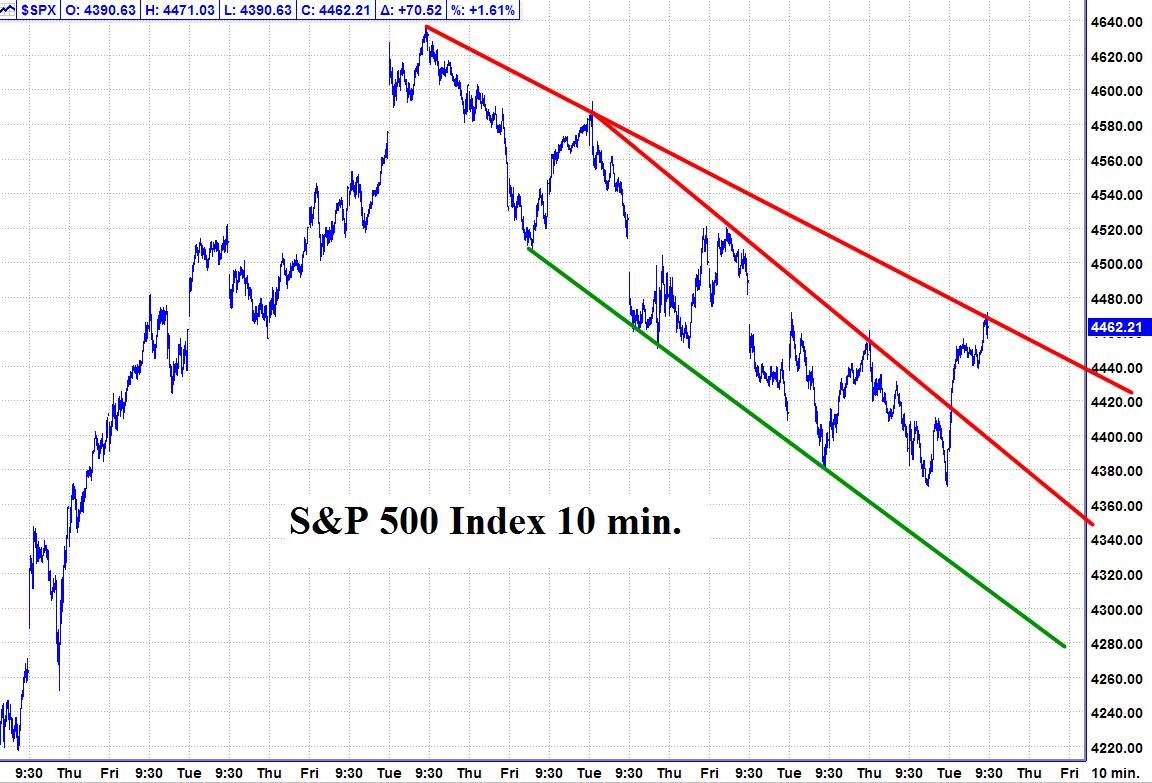
Please see below the S&P 500 10 minute chart.
Support - 4400 Resistance – 4460.
Tuesday, the S&P broke out over the top of its short term trading channel and is now at the top of its longer term down trend channel per the chart below.
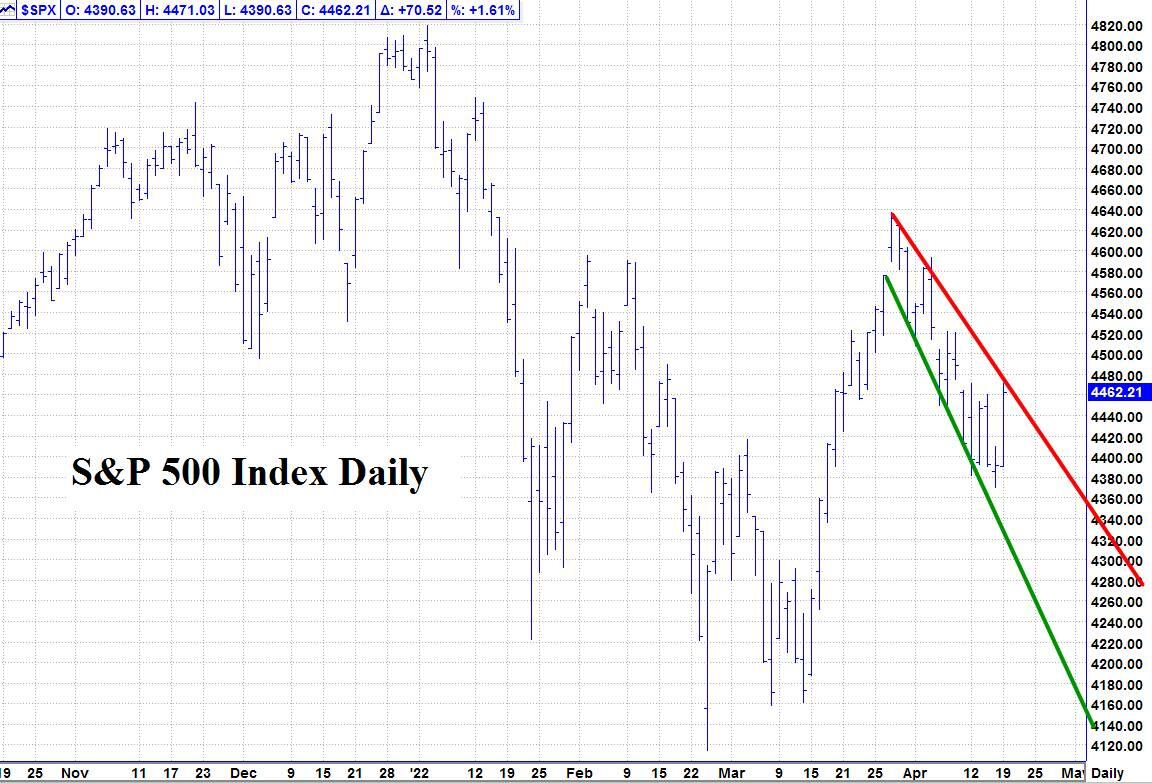
Please see below the S&P 500 Daily chart.
Support - 4400 Resistance – 4460.
Please see below the March Planetary Index charts with S&P 500 10 minute bars for results.
Author

Norm Winski
Independent Analyst
www.astro-trend.com