Copper trade idea analysis: Strong long-term story, but not a clean entry yet

Copper is one of the most talked-about commodity markets at the moment, and for good reason. The long-term case is strong. Electrification, grid upgrades, renewable energy, electric vehicles, data centres and constrained mine supply all point towards a market that could become much tighter over time.
That, however, does not automatically mean copper is a good long trade today.
The current setup is more complicated. Copper has already rallied strongly, speculative positioning is crowded, visible inventories are still high, China’s property sector remains weak, and the daily chart has not yet confirmed a fresh bullish breakout.
So the trade idea is not a simple “buy copper” call. The better view is more measured:
Copper is structurally bullish, but tactically it needs patience.
At current levels, copper looks more like a conditional long than an immediate high-conviction entry.
The bigger Copper story is still bullish
The long-term bull case for copper remains hard to ignore.
Copper is central to the global electrification cycle. It is used across power grids, buildings, electrical equipment, EVs, charging networks, renewable energy infrastructure, industrial machinery and increasingly in the power systems needed for data centres.
This matters because the world is using more electricity, not less. Grid investment is becoming a major policy priority. EV adoption may not move in a straight line, but the direction of travel is still clear. Renewable energy projects need copper. So do transmission networks, substations, transformers and charging infrastructure.
The AI and data-centre theme has also added another layer to the copper story. It is easy to overstate that part of the argument, but it should not be dismissed. Data centres need power, and power growth eventually means more grid investment. Copper is one of the obvious beneficiaries.
The supply side also supports the long-term case. Copper mine supply cannot be turned on quickly. Large projects take years, permitting is slow, ore grades are declining in many regions, capital costs are high, and political risk remains a factor in several key producing countries.
Chile is still the most important producer, while the Democratic Republic of Congo, Peru, Zambia and Indonesia remain major supply regions. Any disruption in one of these areas can tighten sentiment quickly.
The most important supply signal right now is the concentrate market. Treatment and refining charges have collapsed, with benchmark terms reportedly falling to zero and spot terms deeply negative. That tells us smelters are struggling to secure enough concentrate and are competing hard for feedstock.
That is a serious bullish signal for the longer-term copper market.
But it needs to be interpreted correctly. Tight concentrate does not always mean immediate refined copper shortage. A mine-to-smelter bottleneck can exist while visible refined inventories remain comfortable. That is the key distinction in this trade.
The short-term setup is not as clean
The problem for copper bulls is not the long-term story. The problem is the current entry point.
Copper is already trading at historically elevated levels after a powerful rally. The market is pricing in a lot of good news: electrification, AI demand, supply scarcity, tariff risk and future deficits.
When a trade has a strong narrative, the danger is that the narrative becomes too well owned. At that point, even good news can struggle to push prices much higher unless the physical data starts confirming it.
That is where the picture becomes less convincing.
Visible inventories across the major exchanges remain high by recent standards. COMEX stocks have been elevated, partly because tariff uncertainty has encouraged copper to move into the United States. LME and SHFE stocks also need watching closely.
If copper were in an immediate refined shortage, the physical market would usually show clearer signs of stress. Instead, parts of the market have shown contango at times, and Chinese physical import appetite has not been strong enough to remove all doubts.
This does not destroy the bull case, but it weakens the argument for chasing copper aggressively at current levels.
China remains the key demand test
China is still the most important demand variable for copper.
The positive side is that China’s manufacturing data has improved, with the latest PMI moving back into expansion. New orders and production have also shown better signs. High-tech manufacturing, equipment manufacturing, EVs, batteries and grid investment remain supportive areas.
That helps copper.
The weaker side is property. China’s real-estate sector remains under pressure, with investment, new starts and sales still weak. That matters because property and construction have historically been large copper demand channels.
The market is now asking a simple question: can China’s grid, EV, renewable and manufacturing demand offset the property drag?
The answer is probably yes over time, but it has not been proven strongly enough in the short-term data yet. Copper imports have not shown the kind of clear surge that would make the current rally feel fully backed by physical demand.
For copper to become a cleaner long, China needs to show more than policy optimism. The market needs stronger evidence in actual demand, imports, inventories and premiums.
Sentiment is bullish, but crowded
Sentiment towards copper is positive. Possibly too positive.
The market likes the copper story. It fits several powerful themes: critical minerals, electrification, AI power demand, supply scarcity and US tariff risk. These are all credible themes, but the trade is no longer under-owned.
Speculative positioning is heavily net long. That does not mean copper has to fall. Crowded longs can continue to work when the trend is strong. But it does mean the trade has less room for disappointment.
If China data softens, the dollar strengthens, tariffs disappoint, inventories build or physical premiums weaken, copper could see a sharp long-liquidation move. In a crowded market, the exit can become narrow quickly.
This is why sentiment is not an outright positive here. It is bullish, but it is also a risk.
Tariff risk could drive the next major move
US copper tariff policy remains one of the biggest near-term catalysts.
Tariff uncertainty has already distorted the relationship between COMEX and LME copper. Copper has moved towards the US because traders have tried to position ahead of possible duties. That has supported COMEX pricing and encouraged warehouse inflows.
A stronger-than-expected tariff outcome could support the bullish case, especially for US copper pricing. But a softer policy path, delay, exemption structure or disappointment could quickly unwind part of the tariff premium.
That makes copper more headline-sensitive than usual. The market is not only trading supply and demand; it is also trading policy risk.
Technical analysis: Bullish weekly trend, but daily confirmation is missing
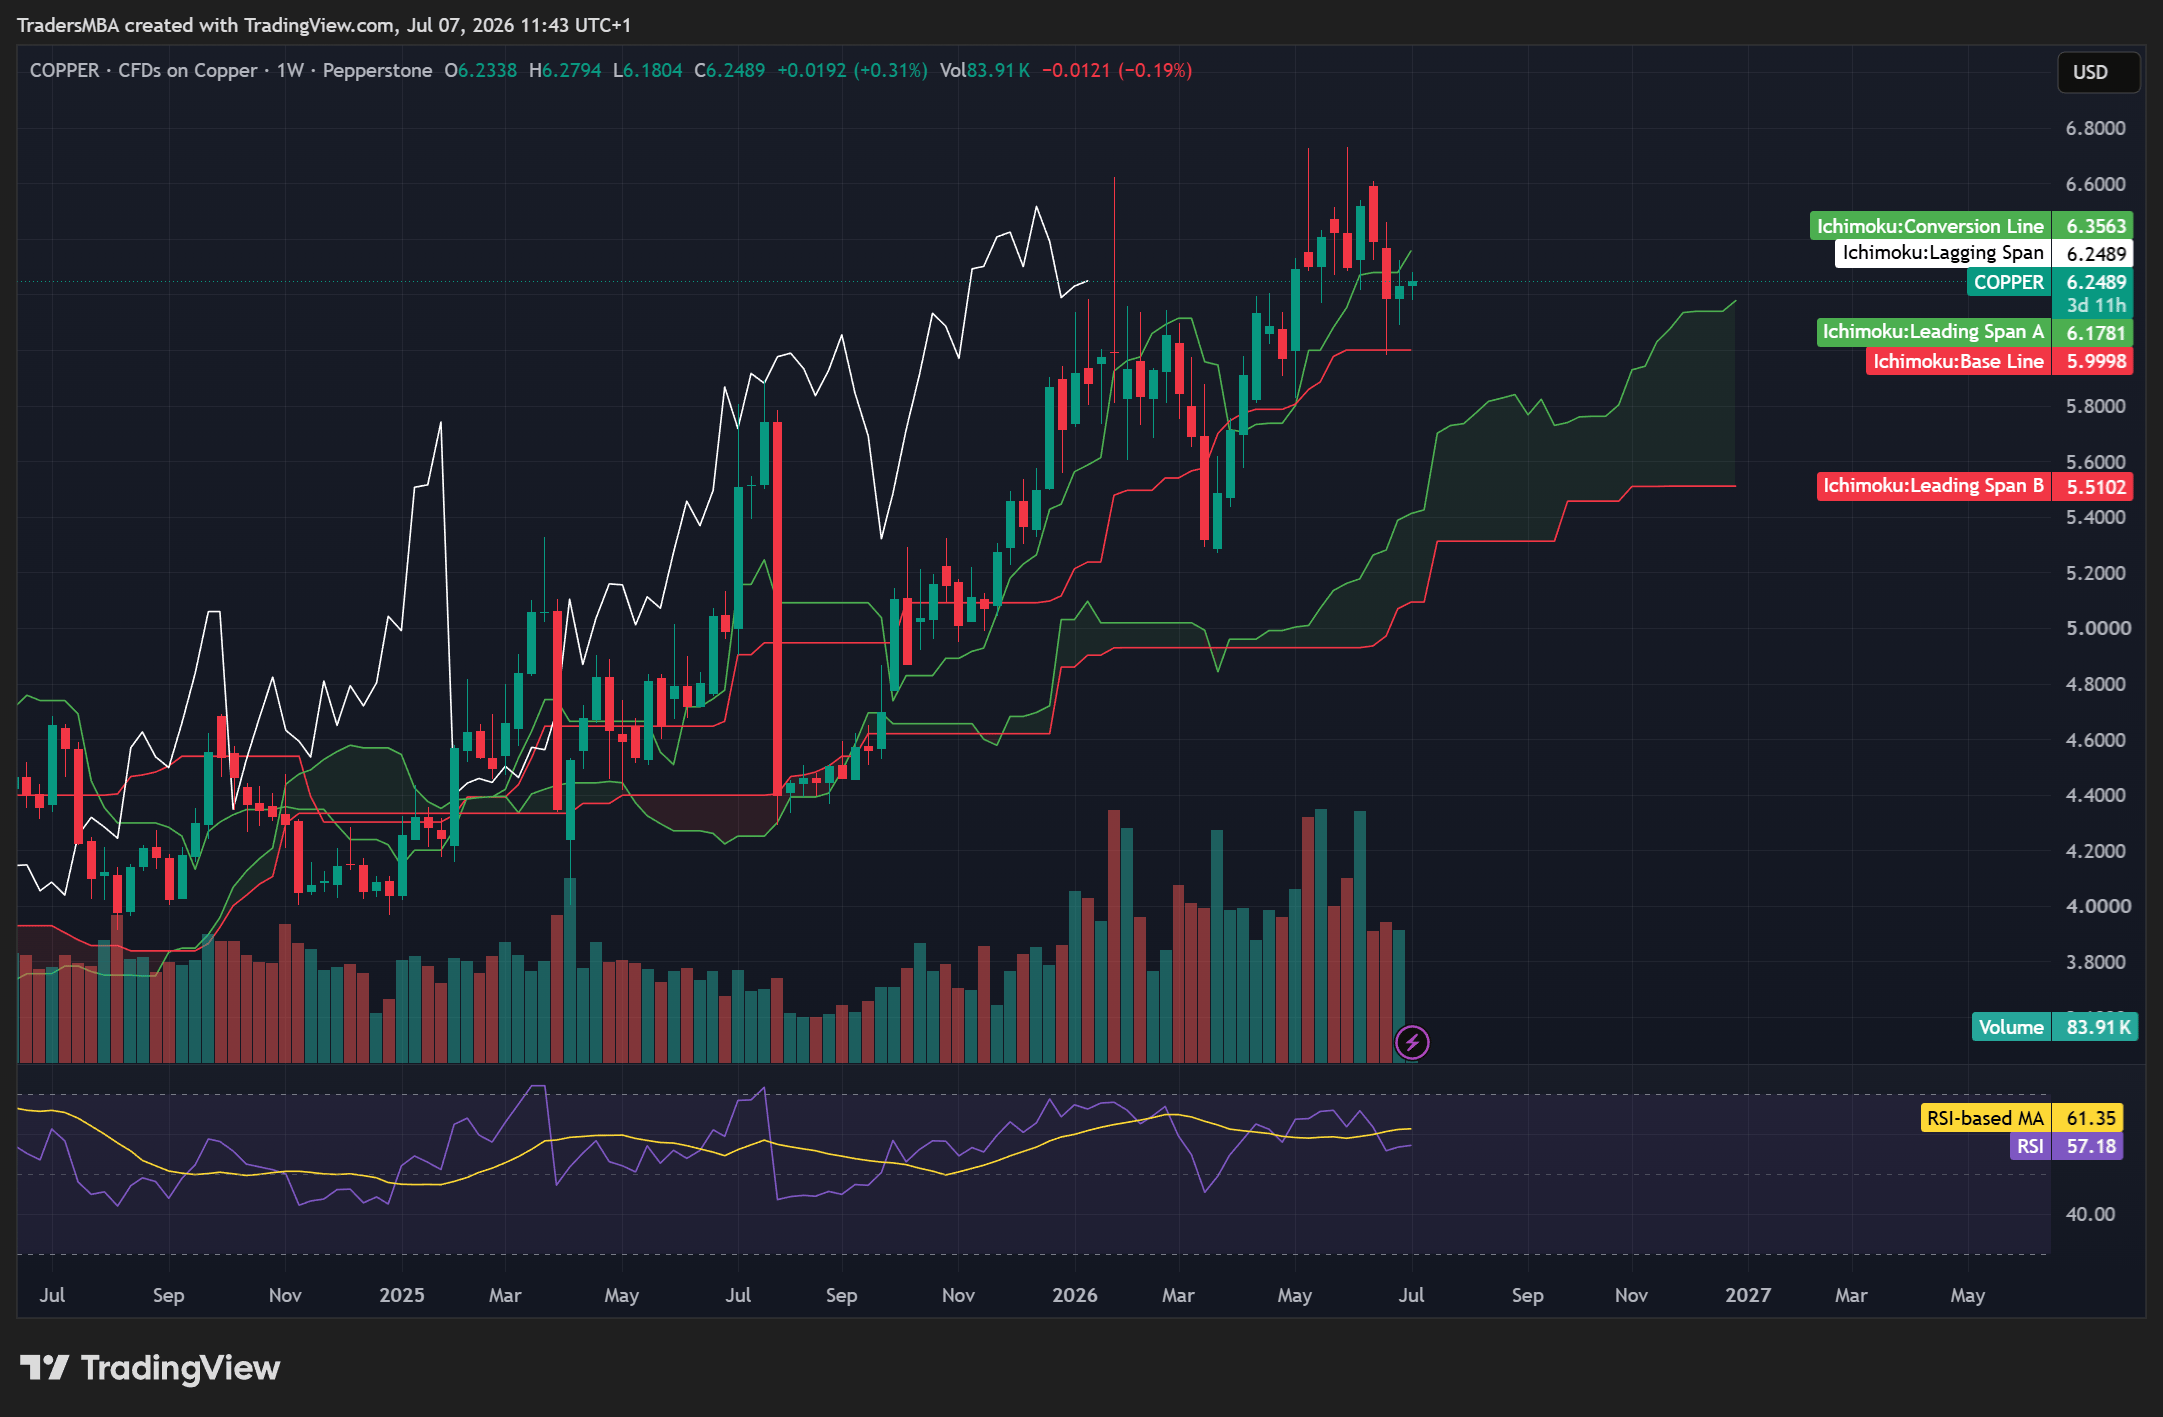
Copper remains above the weekly Ichimoku cloud, which keeps the larger structure constructive. The key weekly support area sits around 6.16–6.18, with the weekly base line close to 6.00. As long as copper holds above those zones, the wider trend has not broken.
Weekly RSI is still positive, sitting around the high-50s, but momentum has cooled. The market is no longer in a clean upside acceleration phase. It is consolidating after a strong move.
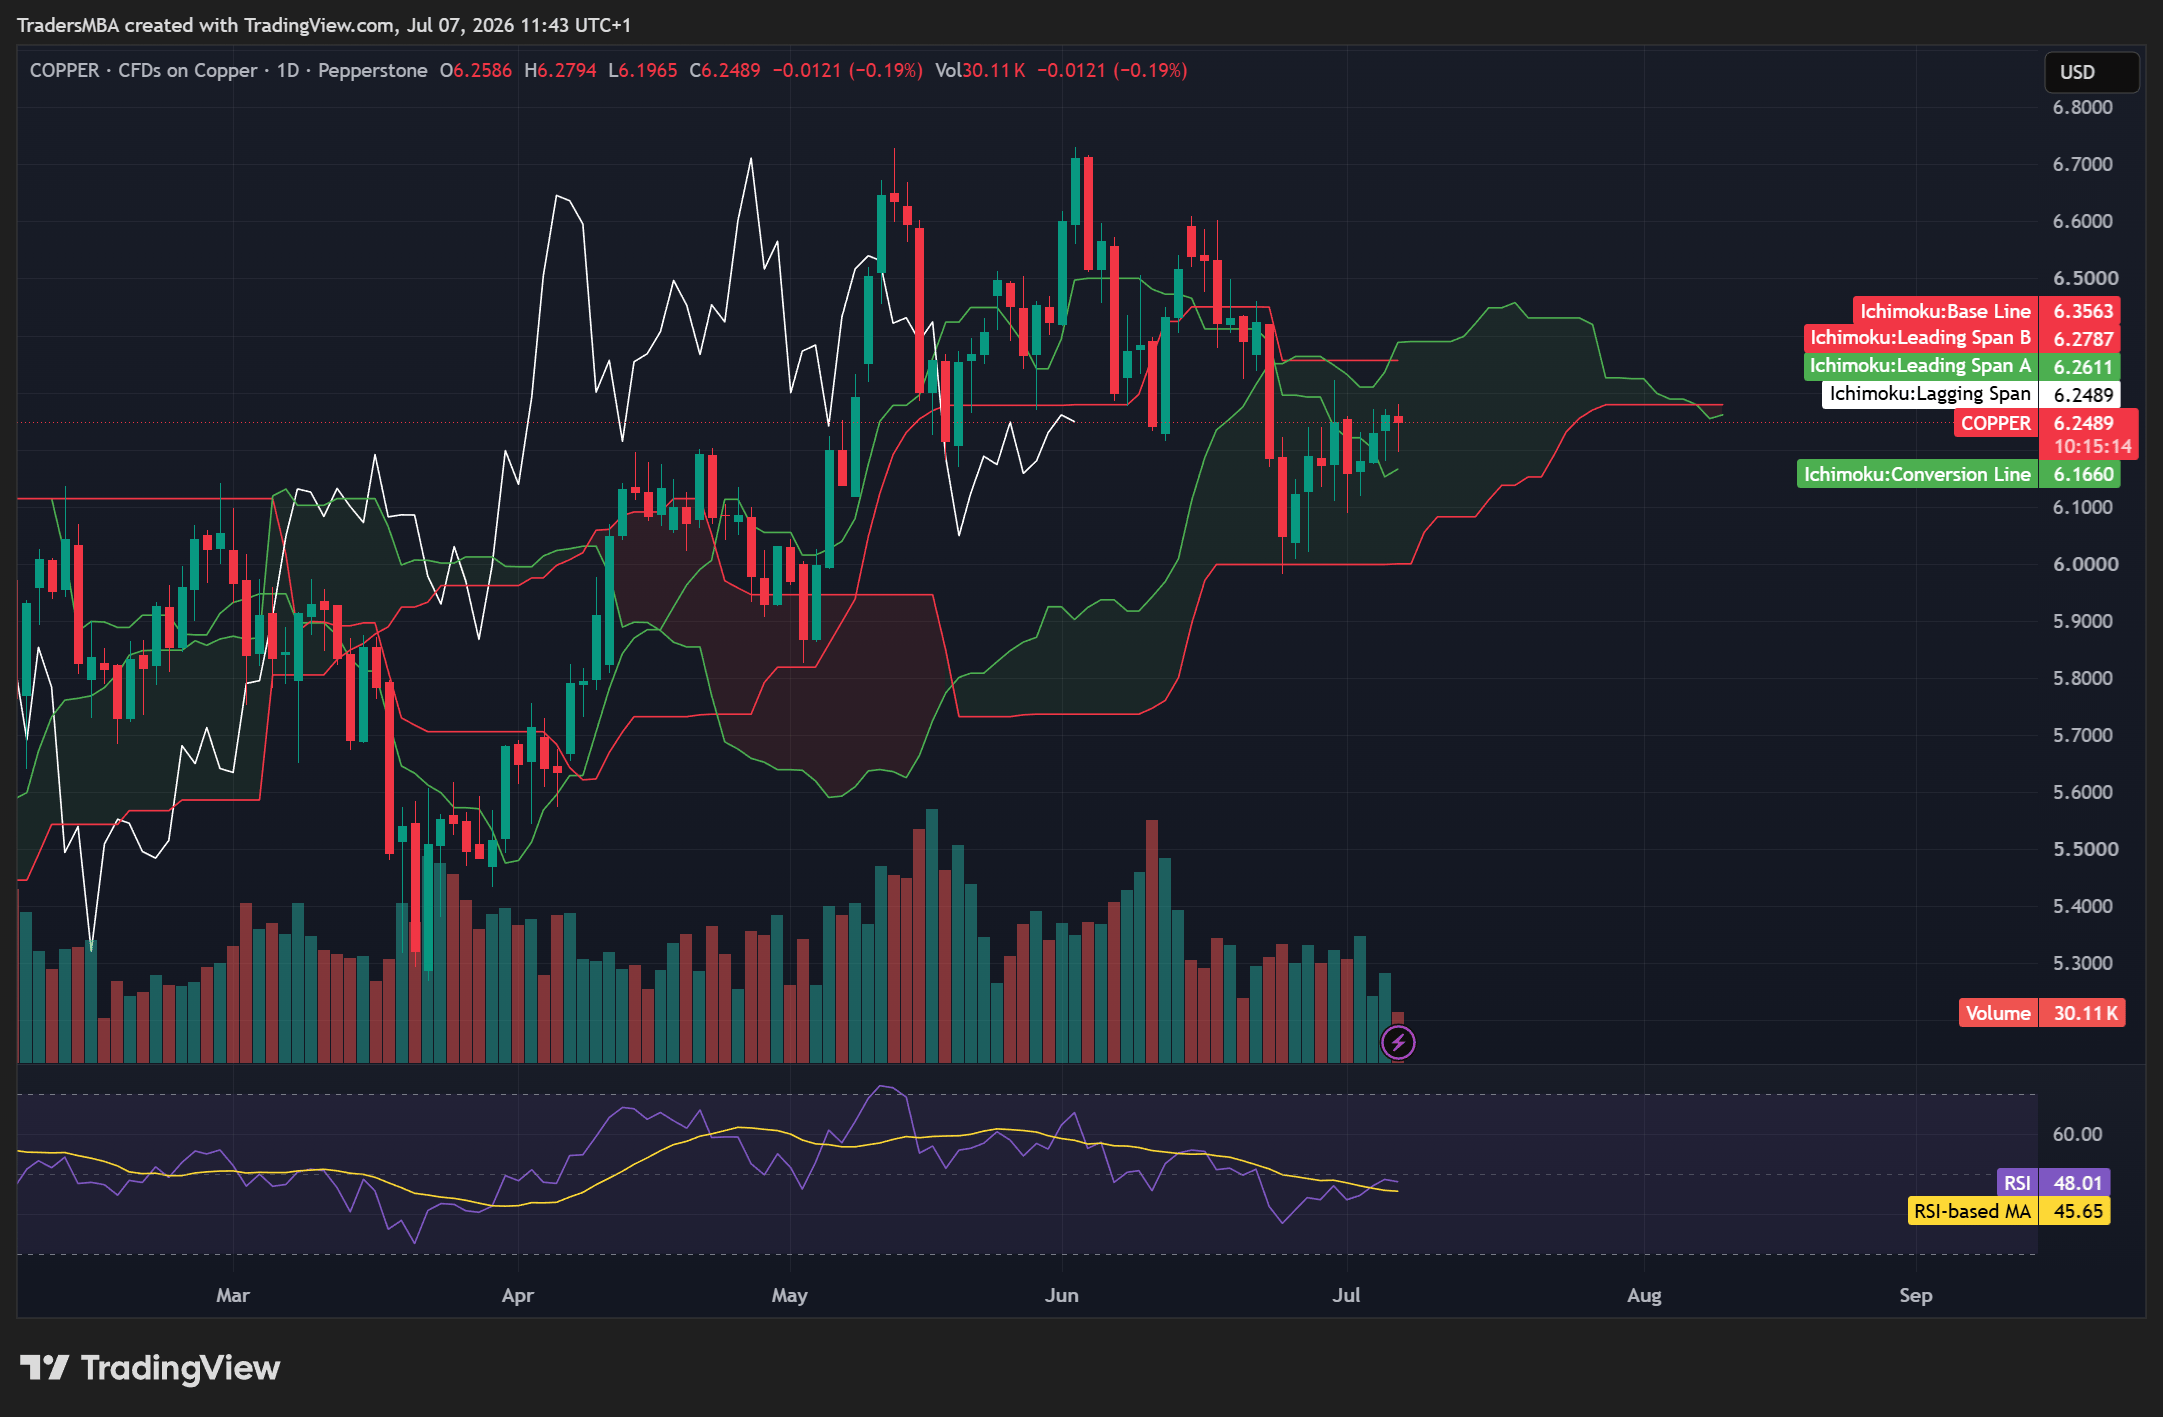
The daily chart is more neutral.
Price is trading around 6.25, close to the lower edge of the daily cloud resistance zone around 6.26–6.28. The more important confirmation level is 6.35–6.36, where the daily base line and weekly conversion area sit.
Daily RSI is around 48, which is not bearish enough to call a breakdown, but not bullish enough to confirm fresh upside momentum either.
The technical picture is therefore mixed:
- The weekly trend is still bullish.
- The daily chart is consolidating.
- Buyers have stabilised the market, but have not regained full control.
- A clean breakout is still missing.
The key levels are straightforward:
Resistance
6.26–6.28 first, then 6.35–6.36 as the major confirmation zone. Above that, 6.45–6.50, 6.60 and 6.70 come into view.
Support
6.16–6.18 first, then 6.00 as the major weekly line in the sand. Below 6.00, the risk opens towards 5.80–5.90.
A daily close above 6.35–6.36 would make the long setup much more attractive. A break below 6.16–6.18 would weaken the idea. A weekly close below 6.00 would damage the bullish structure properly.
Bullish scenario
The bullish scenario needs confirmation from both price and physical data.
Copper becomes a stronger long idea if it can break and hold above 6.35–6.36. That would show the market has reclaimed key technical resistance and that buyers are back in control.
The fundamental confirmation would come from stronger Chinese copper imports, better physical premiums, falling visible inventories, stronger grid demand and continued evidence of concentrate tightness feeding into refined market tightness.
In that scenario, copper could push back towards 6.45–6.50, then 6.60, with the previous high region around 6.70 becoming the next major test.
This would be the cleaner long setup: structural bull case, improving physical evidence and technical confirmation all pointing in the same direction.
Bearish scenario
The bearish scenario does not require the long-term copper thesis to collapse. It only requires the current price to be too far ahead of the evidence.
That could happen if China’s property sector remains weak, copper imports stay soft, visible inventories continue to build, the dollar strengthens, real yields rise, or the tariff premium fades.
The biggest market risk is long liquidation. With speculative positioning already crowded, a disappointment could create a fast move lower as traders reduce exposure.
Technically, the first warning would be a break below 6.16–6.18. The more serious signal would be a weekly close below 6.00. That would suggest the broader bullish structure is no longer comfortably intact and could open a move towards 5.80–5.90.
This would not necessarily make copper a long-term bear market, but it would make the current long idea unattractive.
Trade idea scorecard
Category | Score |
Medium/long-term fundamentals | 7/10 |
Short-term fundamentals | 5.5/10 |
Sentiment | 5/10 |
Technicals | 6/10 |
Risk/reward at current levels | 5/10 |
Overall trade quality | 6/10 |
The scores reflect the main issue with copper right now. The bigger picture is good, but the entry quality is only average.
The fundamentals are stronger over the medium and long term than they are over the next few days or weeks. Sentiment is supportive, but crowded. Technicals are positive on the weekly chart, but not yet confirmed on the daily chart. Risk/reward is acceptable only if the trade is managed around clear confirmation or support levels.
Final verdict
Copper is not a high-quality short. The long-term supply and demand story is too strong for that. Electrification, grid investment, EVs, renewable energy, AI-related power demand and slow mine supply growth all support the broader bullish case.
But copper is also not a clean long entry yet.
The market has already priced in a lot of optimism. Visible inventories are still too high to confirm an immediate refined shortage. China’s property weakness remains a drag. Import demand is not strong enough to fully validate the rally. Speculative positioning is crowded. The daily chart is still stuck in a decision zone.
The best trade idea is therefore a conditional long, not an immediate chase.
A confirmed move above 6.35–6.36 would improve the setup and could justify a more bullish stance. A healthier pullback into support could also create a better opportunity, especially if inventories start tightening at the same time.
Until then, copper is a watchlist trade.
The strongest view is simple: Structurally bullish, tactically patient.
Author

Sachin Kotecha
International Trading Institute (ITI)
Sachin Kotecha is a multi-asset trader, Professor at the International Trading Institute, and creator of institutional trading frameworks, macroeconomic intelligence platforms, and professional trading education programmes.