China PMIs return to expansion territory, signalling modest growth uptick
China’s official manufacturing purchasing managers’ index rose back into expansion territory at 50.1, while the non-manufacturing PMI showed a surprising recovery to 50.2. The data suggests we will see a modest uptick in economic activity in September.
Manufacturing PMI returns to expansionary territory
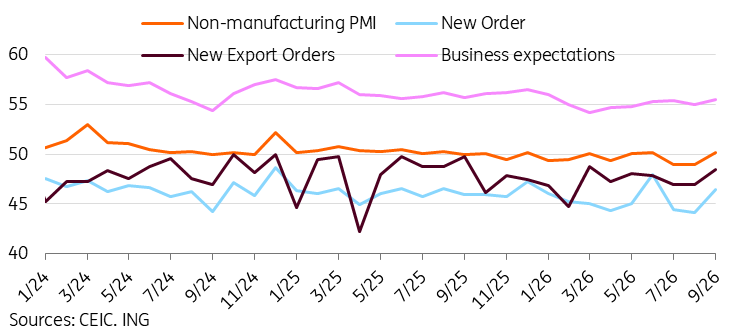
China's official manufacturing PMI data rose to 50.1 in September, coming in line with expectations (market: 50.1, ING: 50.1). This was the first time in three months that this survey has been above the 50-threshold demarcating expansion and contraction.
Looking at the subindices, the production subindex rose to 51.7, the highest level of 2026. New orders and new export orders both edged down 0.1pp to 50.5 and 50.0, respectively. The price subindices also picked up amid higher tech and energy prices. The raw material price subindex rose to a 5-month high of 60.8, and ex-factory prices rose to 54.0, also a 5-month-high.
The RatingDog manufacturing PMI, which uses a more export-oriented sample, unsurprisingly looked a fair bit stronger than the official PMI, up to 52.1 from 51.5.
Overall, manufacturing has been a relative strength this year, though it has mostly been driven by external demand as domestic consumption and investment lag. Measures announced by the State Council earlier this week may help bridge that gap a bit by year-end. But the divergence in China's economy remains clear.
Manufacturing PMI returns to expansion as production hits a 2026 high
Non-Manufacturing PMI beats expectations
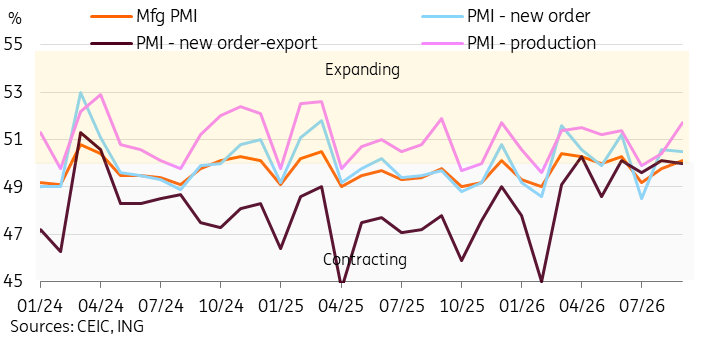
The official non-manufacturing PMI rose to 50.2, comfortably beating expectations for a smaller uptick (market: 49.2, ING: 49.2).
The subindices showed broad-based improvement in September. While still in contraction territory, new orders and new export orders both picked up, rising to 46.5 and 48.5, respectively. Business expectations rose to 55.5, which was the highest level since January. The price-related subindices also rose, with input prices up to 52.5, the highest level since 2023. Sales prices rose to 50.3, the first time they have been above 50 in three years.
The RatingDog services PMI also beat forecasts, rising to 51.6.
Non-Manufacturing PMI surprisingly returned to expansion
PMI data hints at a modest September recovery
The PMI data suggests that we will see a modest uptick in September's activity data when it comes out in a few weeks. Along with more favourable base effects, this might be enough to help third-quarter GDP recover from the 4.3% we saw in the second quarter.
The price subindices in today's data also suggest inflation could heat up a bit in upcoming data. This should come as no surprise given higher energy prices as the Middle East conflict drags on.
The State Council signalled more policy urgency, and the People’s Bank of China (PBOC) has already expanded its suite of targeted policy easing measures. This includes a 25bp cut to the pledged supplementary lending rate and expanded relending programmes. The Ministry of Finance, PBOC, and National Financial Regulatory Administration also jointly announced a mortgage interest subsidy of 1pp for eligible first-time homebuyers. Further policy support measures are likely to be rolled out. They should help China meet this year's GDP target of 4.5-5.0%.
China's K-shaped divergence this year has been quite striking. While we expect resources to continue to be funnelled into strategic priorities such as AI, tech self-reliance, and industrial upgrading, efforts to address the lagging parts of the economy will be key to rebalancing and achieving healthier and more sustainable growth.
Author

ING Global Economics Team
ING Economic and Financial Analysis
From Trump to trade, FX to Brexit, ING’s global economists have it covered. Go to ING.com/THINK to stay a step ahead.