Bonds just gave Gold and Silver a second wind

According to COT data released on 31 July, large specs (short for speculative traders) are heavily long 2-year and 5-year Treasury futures.
Large specs are professional market participants such as hedge funds, commodity trading advisers and other large money managers. Their positions are tracked because they can offer a useful view of how bigger traders are leaning.
By going long Treasury futures, these big players are positioning for note prices to rise. Since note prices and yields move in opposite directions, which tells me that they are leaning towards lower 2-year and 5-year yields.
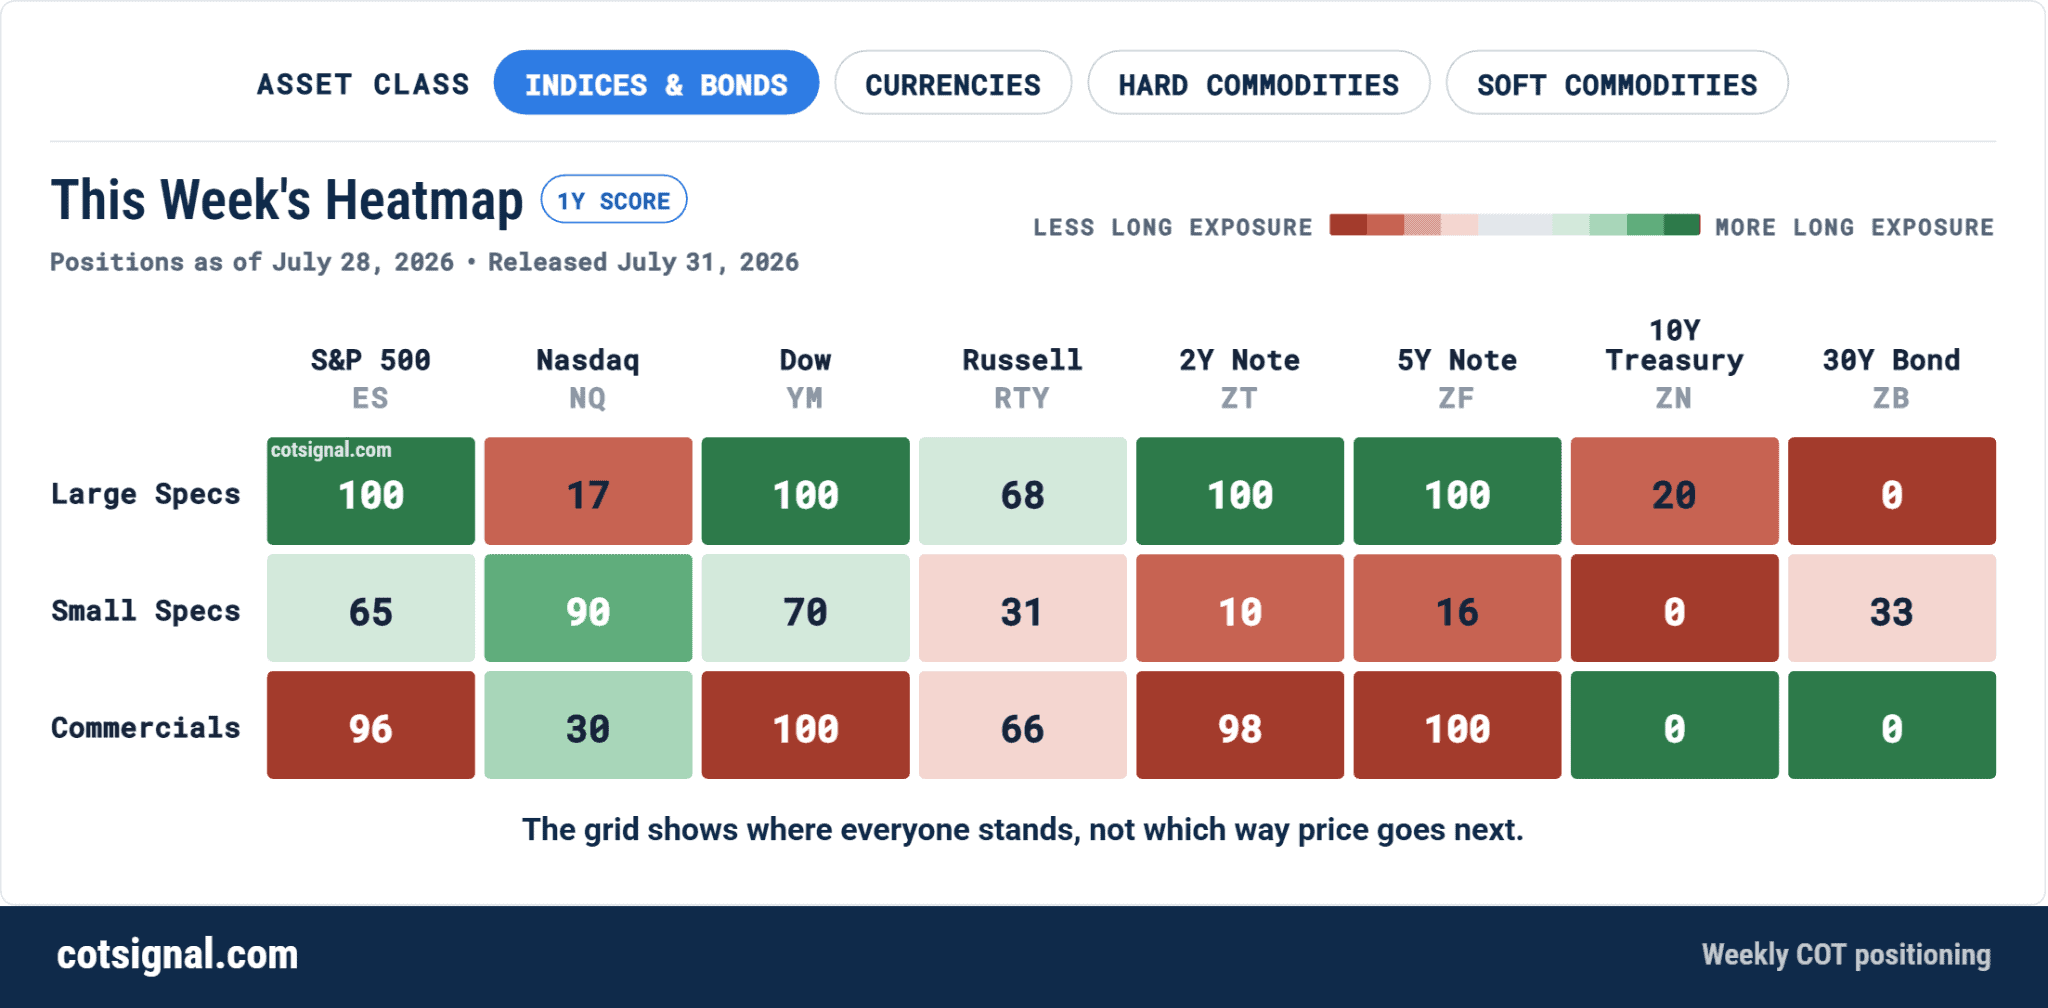
These are historically great conditions for Gold and Silver.
Earlier this year, one of the biggest pressures on the metals was the fear that sticky inflation would force the Fed to stay hawkish. Short-term yields pushed higher, and gold began losing momentum.
But now, the script may be flipping.
Take a look at the chart below. It compares gold with the 2-year minus 30-year Treasury yield spread.
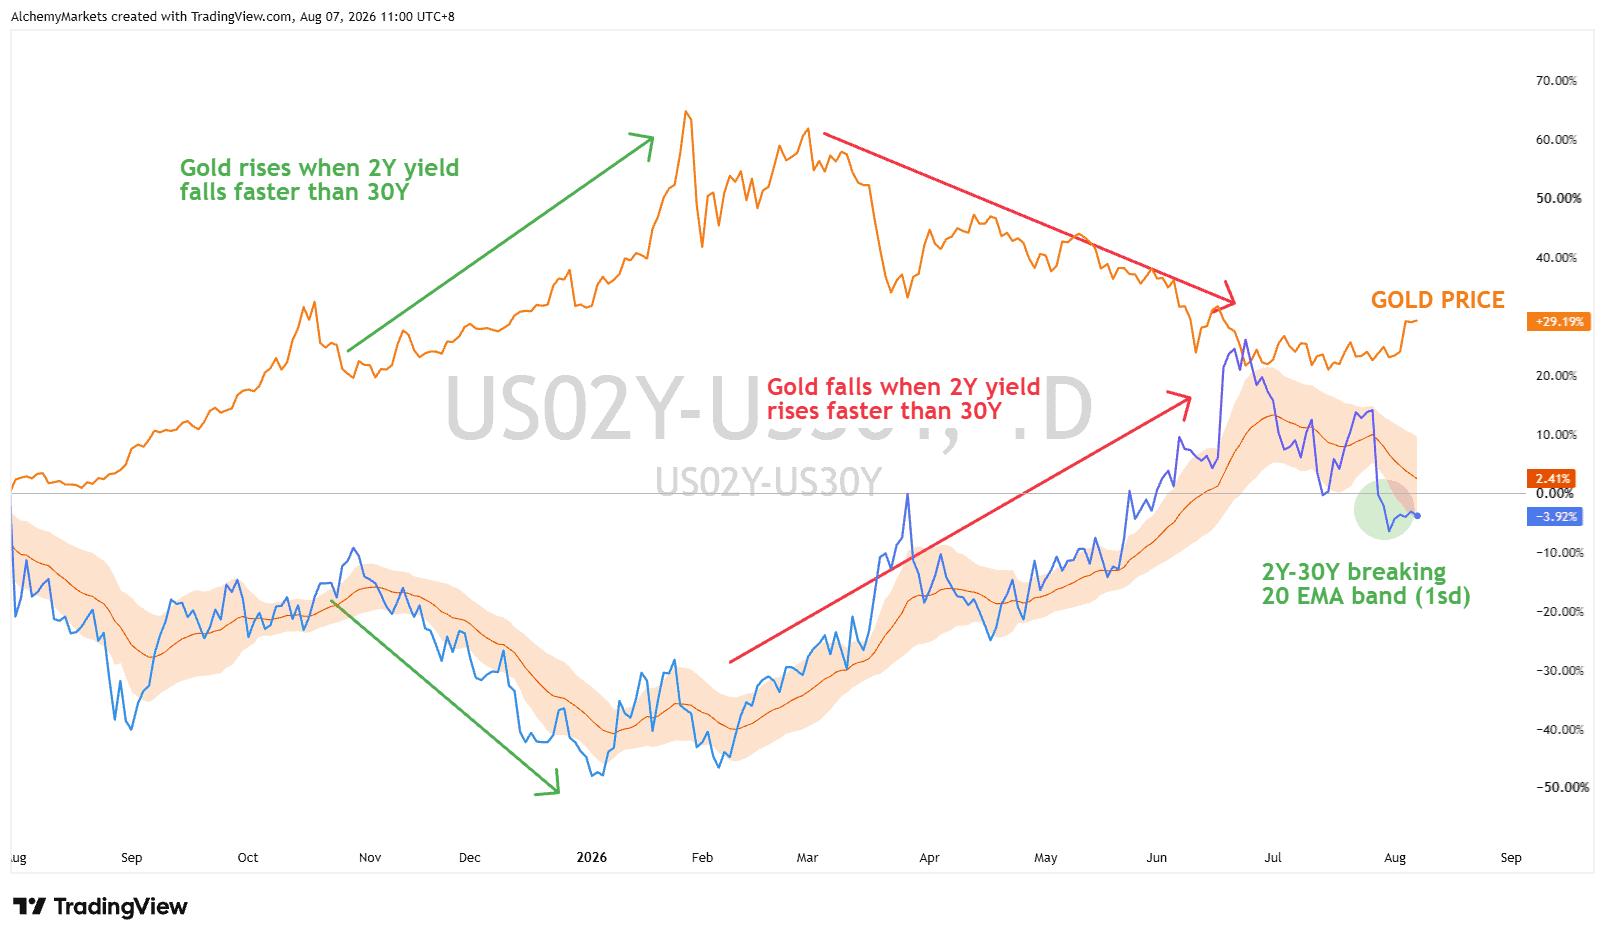
The blue line shows how the 2-year yield is moving against the 30-year yield.
When the line trends higher, the 2-year yield is rising faster, or falling more slowly, than the 30-year yield. That usually points to stronger pressure from near-term Fed policy.
Notice how gold tends to struggle during those periods.
When the line trends lower, the 2-year yield is weakening relative to the 30-year yield. If the 2-year is falling faster, it suggests that immediate rate pressure is starting to cool.
Gold has generally done much better when that happens.
One technical tell I like on this chart is the break of the 20 EMA band, created using Bollinger Bands set at one standard deviation.
Back in November 2025, the spread broke below the band and started trending lower. Gold then moved into a much stronger uptrend.
Earlier this year, the spread broke back above the band as pressure from short-term yields returned. Gold subsequently began falling.
Now, we have just seen another break below the 20 EMA band.
It looks similar to the shift we saw in late 2025, when the 2-year yield began losing ground against the long end and gold started pushing higher.
It still needs follow-through, of course. But for the first time in a while, the rates backdrop is starting to look less hostile for metals.
Gold and Silver are stronger, but resistance is close
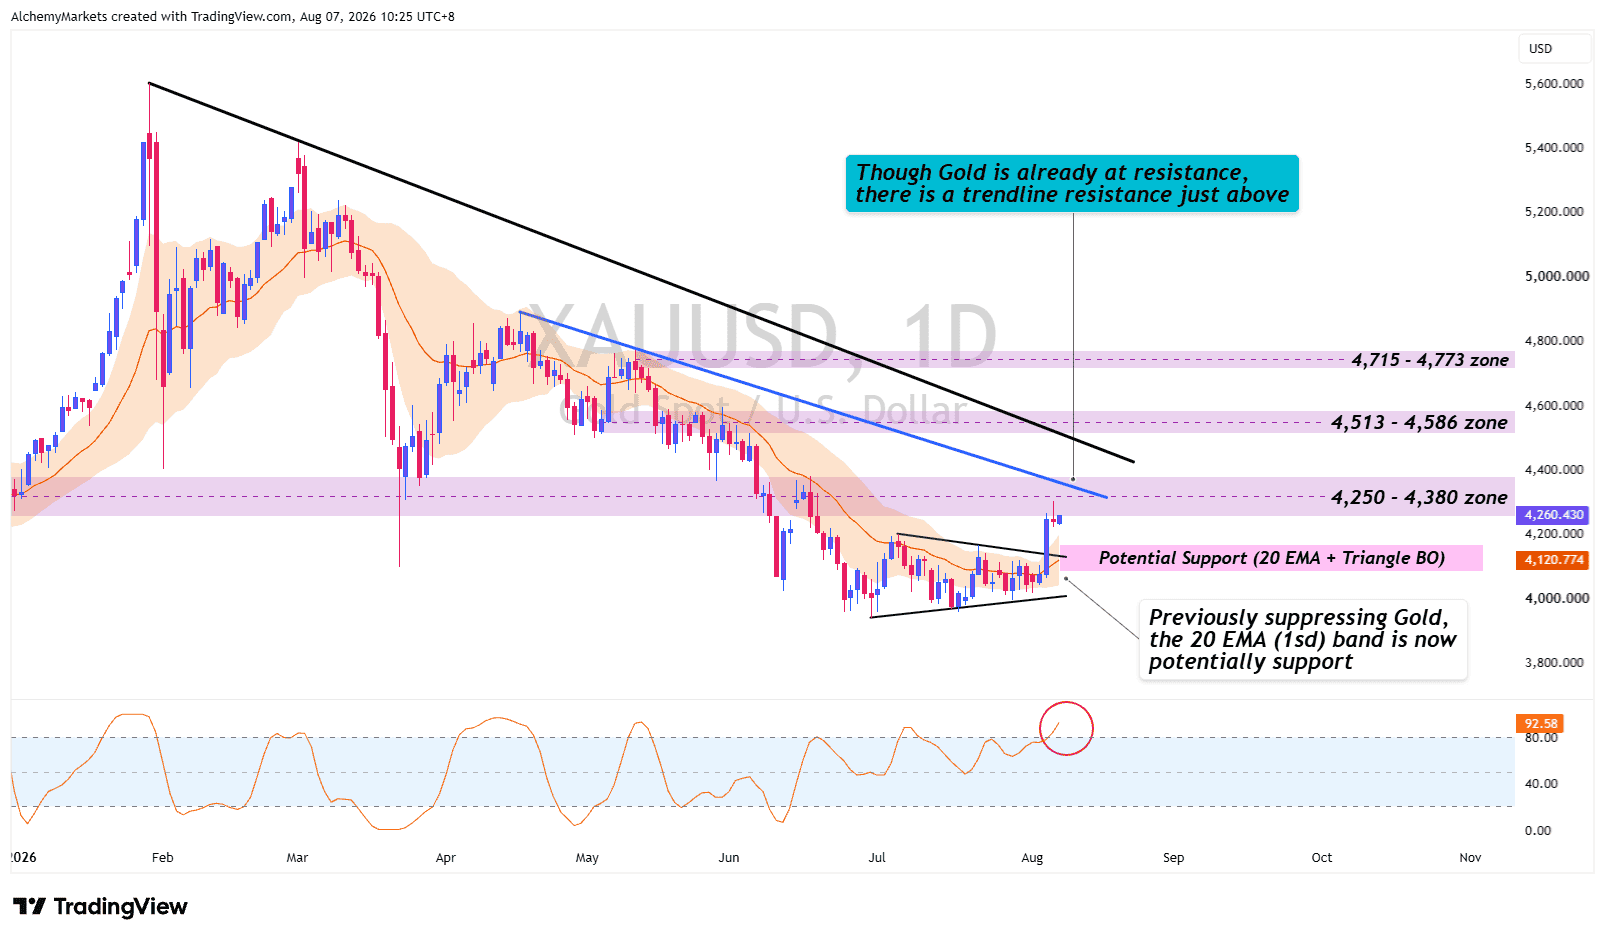
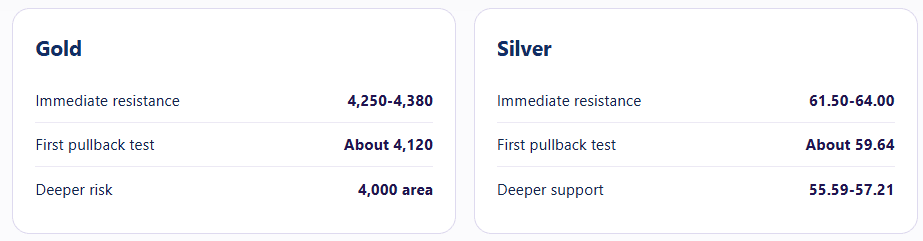
Gold has now returned to the 4,250 to 4,380 zone. This was previously an area where price found support, before rejecting from the same region again in late June. So we already know this zone has enough weight to turn the market.
Daily Stoch RSI is also flashing overbought after gold’s sharp rise. That does leave the door open for a short-term retracement.
There is one important difference this time, though. Gold is now trading above the 20 EMA band (set via Bollingers), which had been suppressing price since March. The move also came after a breakout from the recent triangle pattern.
So if gold pulls back towards the 20 EMA band and the triangle’s former upper trendline near 4,120, I would personally watch for a bullish reaction. If that area fails, however, the 4,000 region could come back into view.
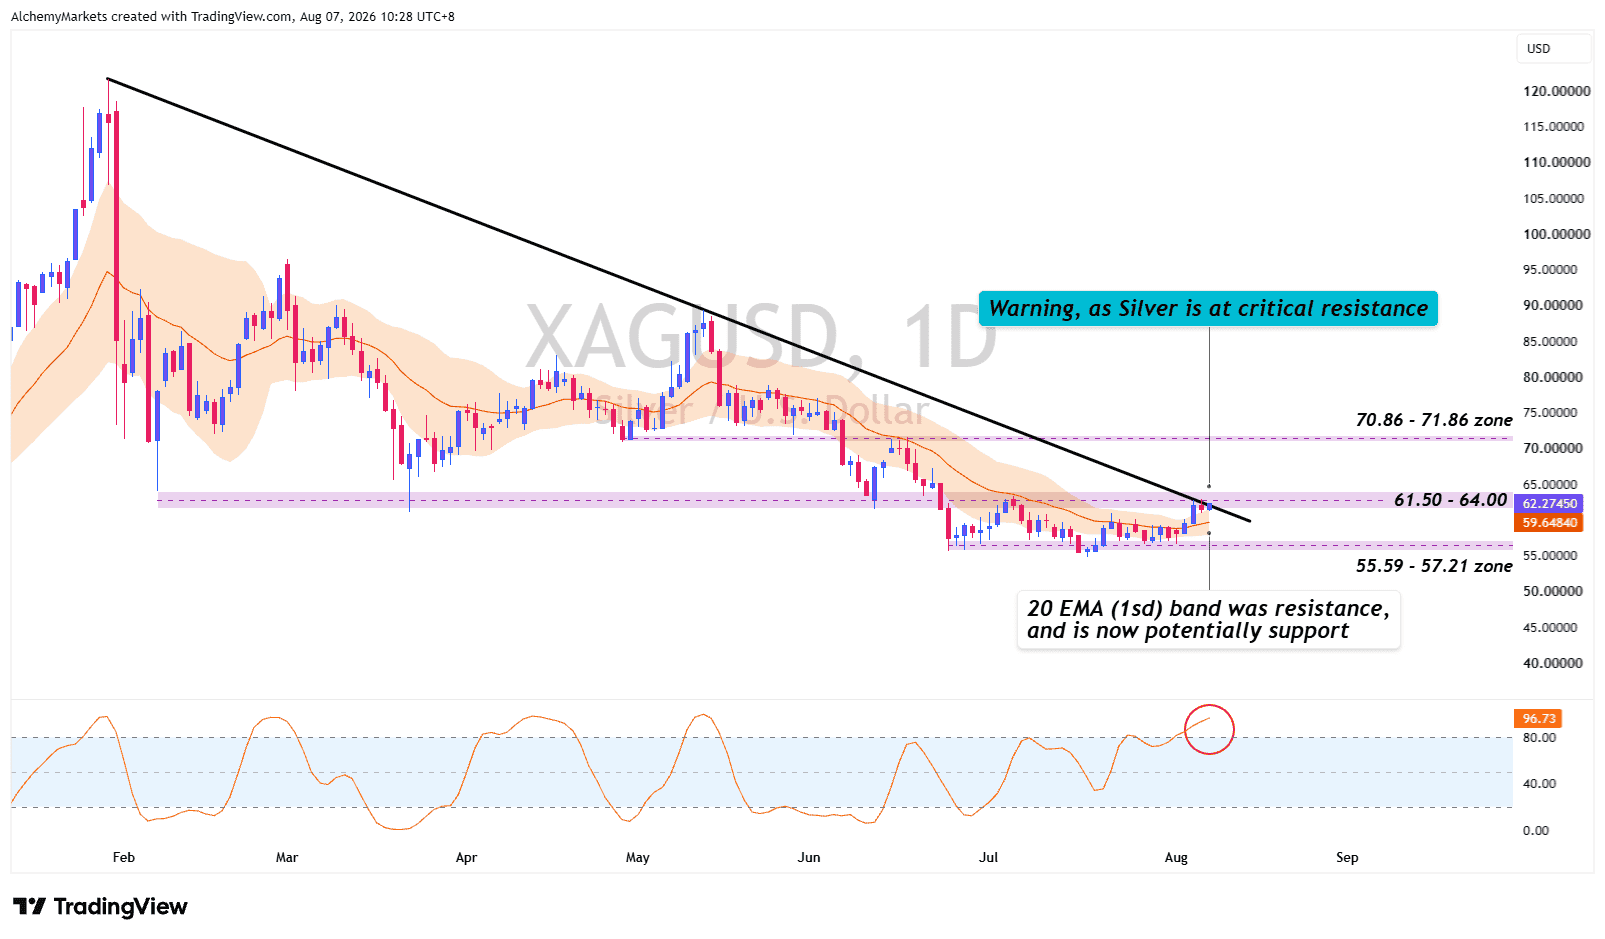
For silver, the technical picture is even simpler. Price is now testing a clear descending trendline that has been in place since February.
Pair that with an overbought daily Stoch RSI, and a small retracement would not be surprising. Silver has also broken above its 20 EMA band and that makes 59.64 the main area I would watch on a pullback.
If buyers step back in there, it would support the breakout. If price falls back below the band, silver may still need more time before breaking out of the wider downtrend.
Author

Zorrays Junaid
Alchemy Markets
Zorrays Junaid has extensive combined experience in the financial markets as a portfolio manager and trading coach. More recently, he is an Analyst with Alchemy Markets, and has contributed to DailyFX and Elliott Wave Forecast in the past.

















