Bitcoin vs Gold: The 396-day bullish signal just fired again

The BTC/Gold ratio, which tracks Bitcoin’s price relative to Gold, has just completed a technical move that has repeated with precision four times in the past ten years. This ratio measures relative performance – indicating which asset is winning rather than just whether prices are rising – and its recent completion of a 396-day bear cycle suggests a significant market shift could be underway.

Bitcoin/Gold ratio: The 396-day cycle symmetry is back
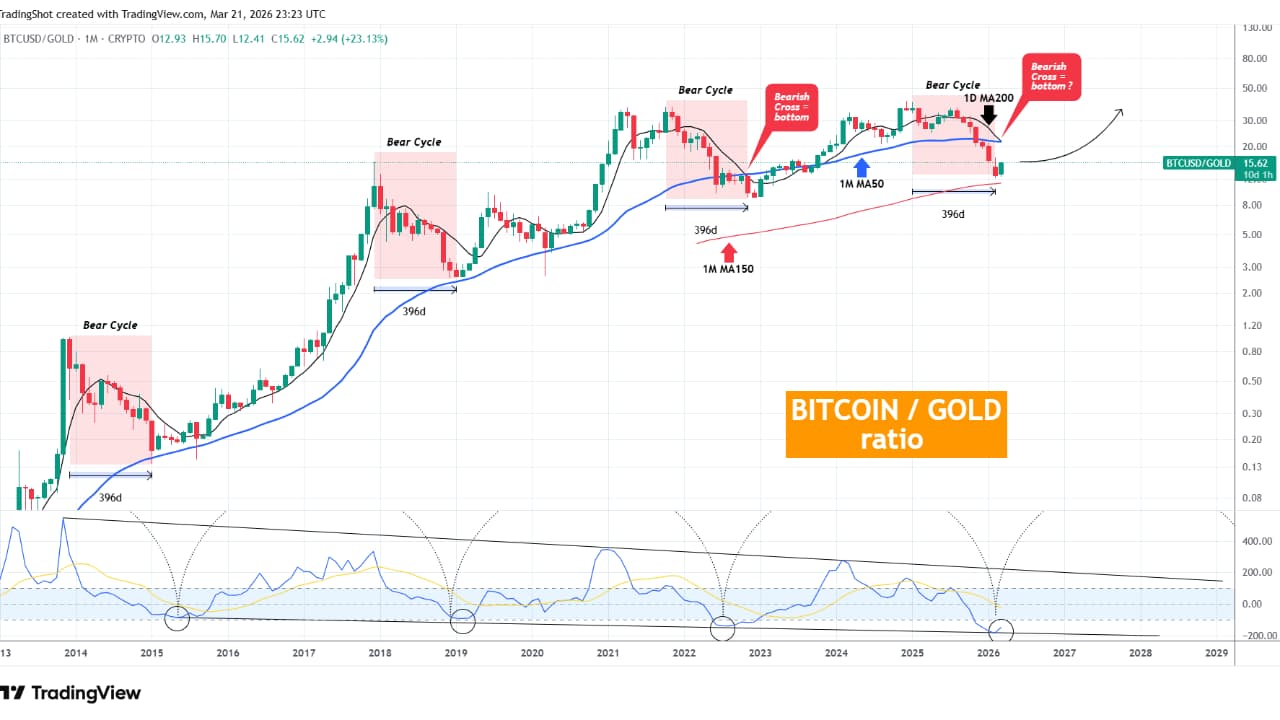
Every bear cycle in the BTC/Gold ratio since 2014 has lasted exactly 396 days, according to an analysis by TradingShot on Binance Square. The current ratio peaked in January 2025 and completed its scheduled 396-day bear cycle this March. This symmetry is reinforced by the Monthly CCI technical indicator, which recently bounced off a lower-lows trendline that has marked every major bottom since 2015.
Additionally, the ratio printed a Bearish Cross between two key moving averages. This is the exact same cross that appeared in November 2022, close to the bottom of the previous bear cycle. Following that 2022 cross, Bitcoin entered a long-term phase that eventually led to a significant recovery. It is important to note that this is a rotation signal rather than a sell-everything alarm: it suggests that Bitcoin may fall more slowly than Gold or rise faster than the precious metal from this point forward.
Gold: The traditional safe haven is struggling
Gold has not performed as the traditional safe haven many expected recently. While geopolitics often dominate headlines, currently Gold's primary driver remains interest rates. With central banks flagging inflation as a persistent risk and discussing the possibility of further rate hikes, the environment has become less favourable for Gold, which is a non-yielding asset.
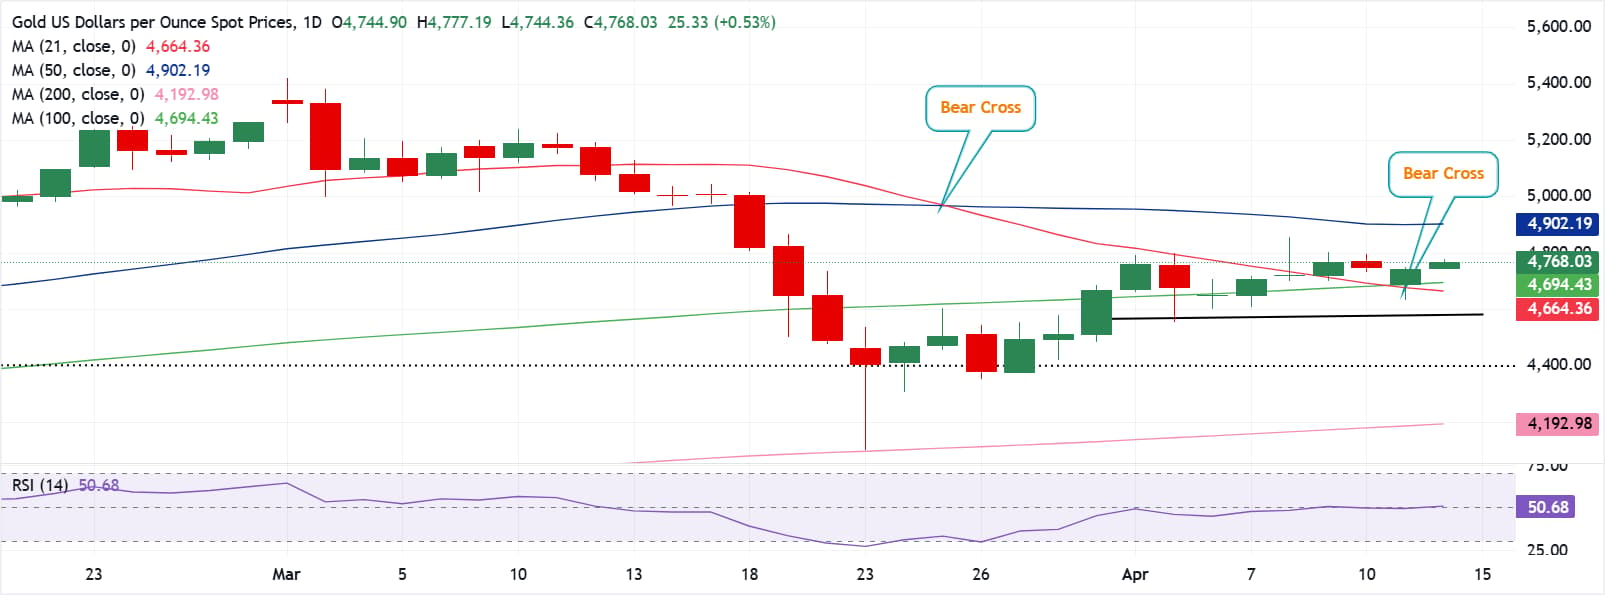
There is also a structural shift occurring. Gold’s massive recent rally was driven largely by its role within the so-called “debasement trade”. However, that trade has recently reversed as investors have been selling Gold for liquidity to cover losses, fund rising energy costs, and manage capital stress. Currently, Gold continues to trade below its 50-day SMA, and while it found a temporary bounce near $4,100, the medium-term outlook remains a "sell-on-bounce" market.
Bitcoin: Consolidations within an improving outlook
On the other side of the ratio, Bitcoin’s technical picture has shown signs of improvement. After being trapped in a defensive range between $60,000 and $75,000 since February with low volume, the market responded positively to news of a two-week ceasefire on April 7. Bitcoin reclaimed its 50-day EMA at $70,300 as dynamic support and subsequently climbed toward $76,000.
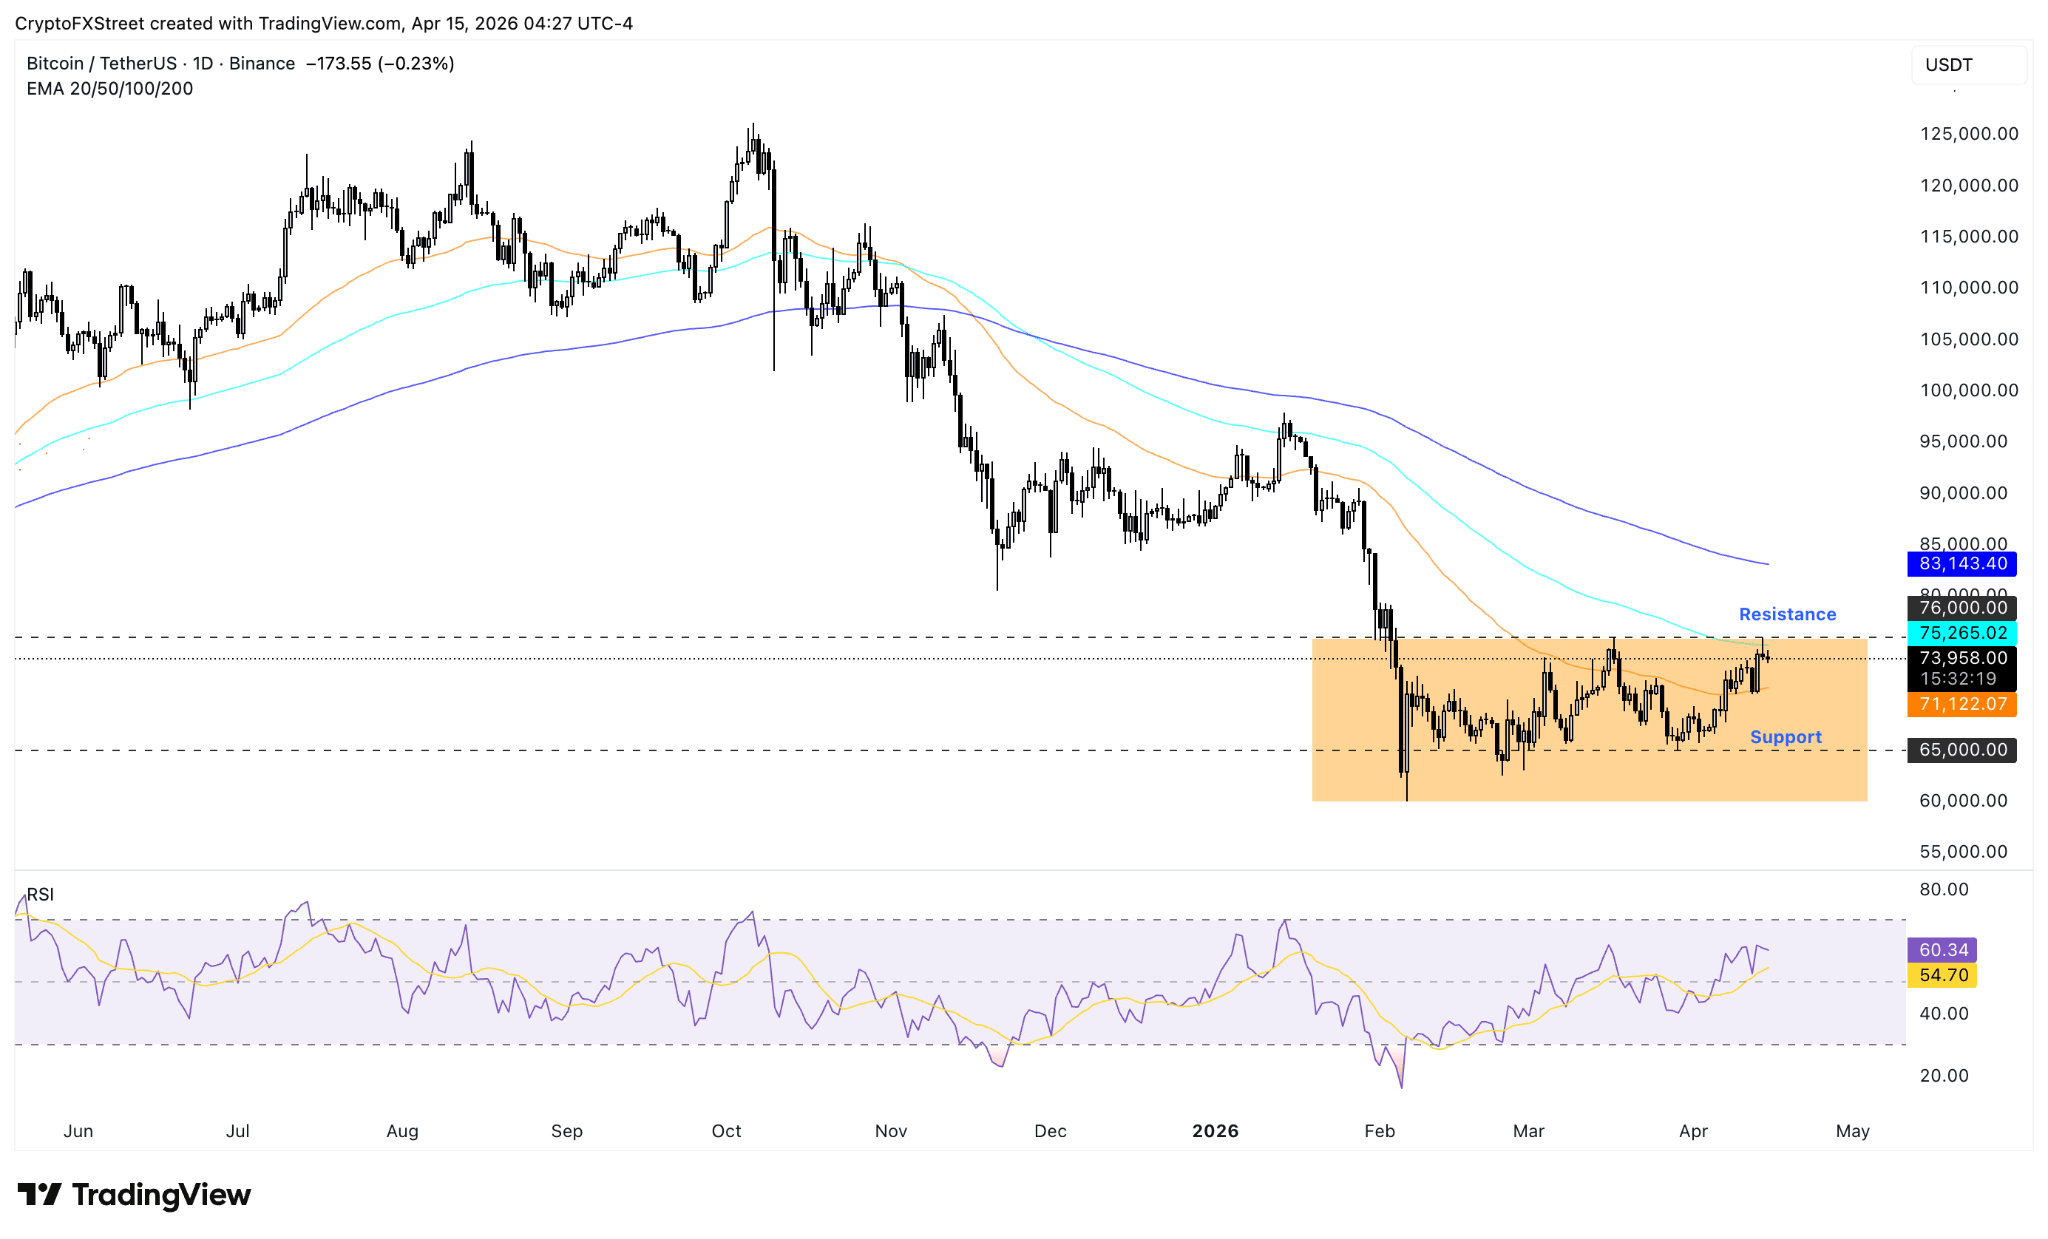
The market is currently consolidating above $73,000, and the breakout requires further validation. While optimism has returned due to diplomatic efforts, investors must remain cautious as geopolitical headlines continue to shift. The current market action shows potential, but directional conviction is still forming.
Levels to look at to confirm the rotation thesis
The definitive trigger for this rotation thesis is a weekly close for Bitcoin above $74,000. A close above this resistance level would confirm the trend, whereas remaining below it suggests the recent move may only be a temporary "headline pop." If Bitcoin fails and closes back below $70,000, the thesis is on hold, and a weekly close below $68,000 would invalidate the rotation signal entirely.
Historically, after every 396-day bottom, the BTC/Gold ratio has rallied into the next cycle, which typically runs six to twelve months from the signal. For those holding significant gains from Gold’s multi-year run, a measured strategy involves trimming Gold profits and rotating them into Bitcoin only once the $74,000 weekly close is confirmed. This approach allows investors to capture potential asymmetry without liquidating entire positions prematurely.
(This article was created with the help of an Artificial Intelligence tool and reviewed by an editor.)
Author
FXStreet Team
FXStreet
Composed of a group of economic journalists and FX experts, the FXStreet content team produces and oversees all content published on FXStreet. It provides a purely journalistic approach to the Forex market.


