AUD/USD Forecast: Next on the downside comes the 200-day SMA
- AUD/USD deepens its pessimistic start of the year.
- Traders now look at Chinese GDP and the Australian jobs report.
- Consumer Confidence eased in January.

Sellers maintained their dominance for yet another session on Tuesday, motivating AUD/USD to retreat to the area of five-week lows in the sub-0.6600 region, approaching at the same time the critical 200-day SMA near 0.6580.
That said, spot navigates the vicinity of the 78.6% of the Fibo retracement of the December rally, which saw the Aussie dollar climb to the 0.6870 region (December 28).
In the immediate future, the mood surrounding the pair is primarily influenced by dollar dynamics. However, the upcoming sessions, marked by significant Chinese and Australian data releases, are expected to shift focus towards more domestic drivers.
Extra gains in the greenback, in the meantime, kept the mood around the Australian currency and the rest of the risk-linked assets depressed, while the mostly bearish tone in the commodity complex helped with the pair’s downward bias on Tuesday.
In the broader scenario, market participants are expected to gauge the upcoming publication of the labour market report in Oz (January 18) against the ongoing speculation of an “on-hold” stance by the RBA at its February event, particularly following the softer-than-expected inflation figures in the country tracked by the Monthly CPI Indicator for the month of December.
In a wider context, market participants are anticipated to assess the forthcoming release of the labour market report in Australia on January 18. This evaluation will be juxtaposed against the prevailing speculation that the RBA is maintaining a "hold" stance at its February event, especially in light of the country's softer-than-expected inflation figures reported in December, as per the Monthly CPI Indicator.
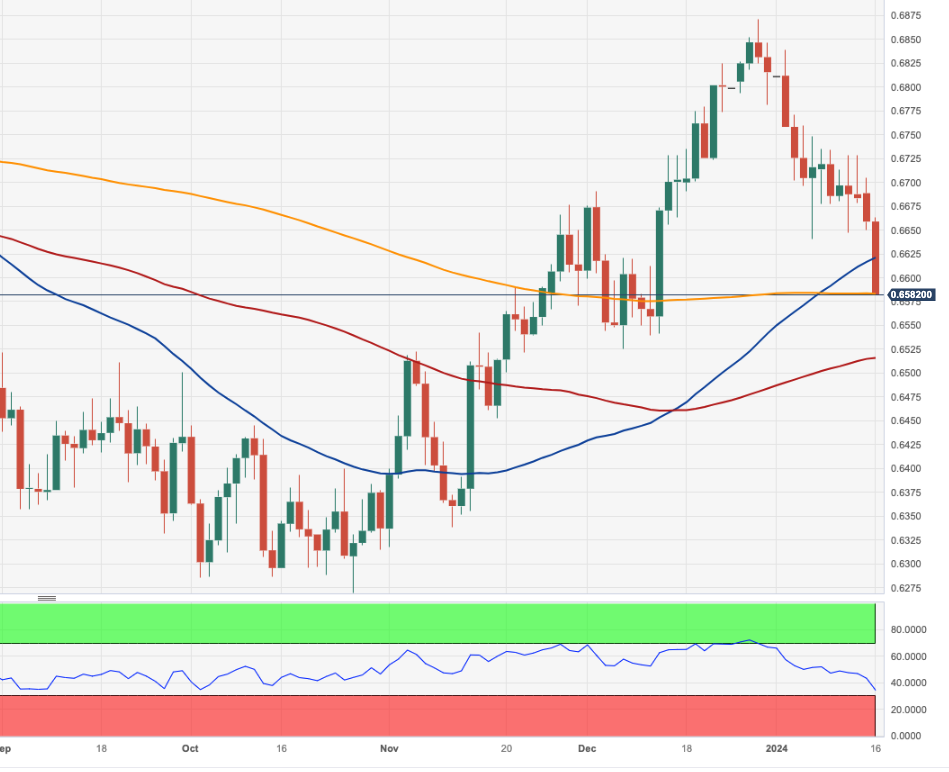
AUD/USD short-term technical outlook
AUD/USD charted a new 2024 low at 0.6581 (January 16), an area coincident with the key 200-day SMA at 0.6581. A deeper pullback could see the December 2023 low of 0.6525 (December 7) revisited prior to the transitory 100-day SMA at 0.6511. Further worsening of the outlook should lead the pair to try to move to the 2023 bottom of 0.6270 (October 26). If bulls regain control, the attention will shift to the December 2023 high of 0.6871 (December 28), which appears before the July 2023 top of 0.6894 (July 14) and the June peak of 0.6899 (June 16), both of which precede the critical 0.7000 threshold.
The bearish tone seems magnified in the 4-hour chart. That said, the breach of the YTD lows now exposes a potential move to 0.6525 and 0.6452. The MACD remains in the negative zone, and the RSI broke below the 30 yardstick, all leaving the door open to extra losses in the very near term. The bullish trend, on the other hand, may encounter first resistance at the 200-SMA at 0.6688 seconded by the 100-SMA, which is seen as the last line of defense before the previous high at 0.6870.
Author

Pablo Piovano
FXStreet
Born and bred in Argentina, Pablo has been carrying on with his passion for FX markets and trading since his first college years.