34 trading days left in 2026: Taking a look at the state of US macro

Is it too early to think about 2027?
While my time horizon is short, a big part of my process is to develop a clear understanding of the current equilibrium so that when new information arrives, or is about to arrive, I have a strong sense of its importance and what is priced in. Good forecasts require good explanations, as David Deutsch says. So once in a while, say on a quasi-holiday in the U.S., I like to level set on the bigger picture stuff. I’ll start by checking in on the U.S. economy now that we have the workhorse data for October.
My first chart today tracks how US data has compared with economists’ expectations since 2010, summed month by month. The black line is a simple labor market surprise index. Each month it adds the payrolls beat or miss and the unemployment-rate miss with its sign flipped (so a lower-than-expected rate counts as strong), each divided by its standard deviation (114k for payrolls, 0.18pp for unemployment) so the two count equally.
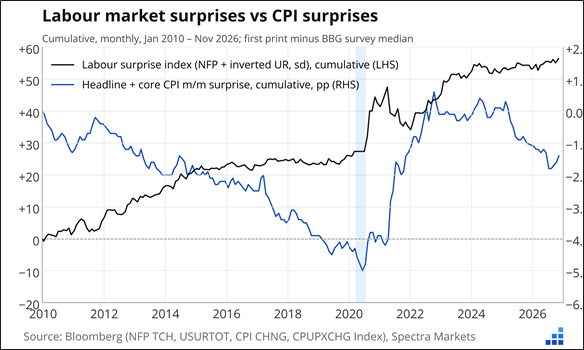
I left out April to July 2020, or else the y-axis goes ape. The blue line is the sum of headline + core CPI m/m misses, in %. For most of the period, the two have moved opposite.
In the 2010s, the labor market kept beating forecasts while inflation kept undershooting. 2021 flipped that: inflation surprised up by 2.6pp in a year while the labor market data briefly disappointed because of the labor supply shock (the economy was booming, but nobody could find workers).
Since 2025 they split again, with the labor index rising while CPI has undershot; jobs keep surprising strong and inflation keeps surprising soft. I should emphasize these are not measures of economic strength or weakness, they are measures of how far off economists have been in their assessment of the U.S. economy. The labor market continues to confound the experts. How can we deliver 100k+ of new jobs every month when breakeven is 25k? Strong like bull.
Here are expectations for 2027. These come from the FOMC but there is no meaningful difference between public and private sector economic forecasts.
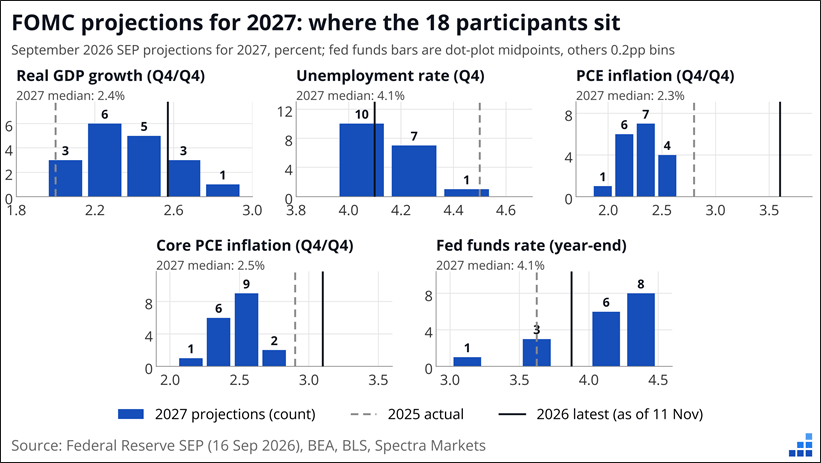
Some of the big questions going into 2027:
- Will peak capex growth knock back U.S. nominal growth?
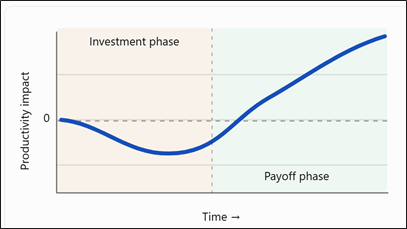
- Will productivity from AI arrive? Or is that a 2028 or 2029 or “never” story? Capital expenditure often has a J-curve, and AI adoption can temporarily depress productivity as we learn the new systems, experiment with and redesign workflows, etc. And the payoff is not guaranteed. Conceptual plot of the J-curve at right.
- How many times will the Fed hike and/or cut? Does Fed policy even matter for markets when they are moving in such tiny increments? They hiked a zillion times and inflation and demand stayed strong. They declared mission accomplished and cut rates before inflation got to target. There is no firm commitment other than saying “we will get there in two years” every year. Monetary policy is without a compass during supply shocks and times of war.
- Will housing recover? There must be a ton of pent-up demand from locked-out young people. At some point they could pull the trigger if rates come off, even a bit. Will buyers react to the delta of mortgage rates, or stay locked out by high levels?
- The energy wildcard. Still the most important variable for headline and core inflation.
- Will the AI flywheel reverse? AI capex = higher stock prices = higher earnings = more spending = more capex = wealth effect = more consumer spending = higher asset prices, etc. Now that the market has stopped rewarding the capex arms race, could this whole machine turn into a financial calamity as supply of capital slows and over-levered borrowers get locked out like home buyers?
- Will the fiscal boogeyman come back? The U.S. fiscal balance has been a major concern since 1968 or so, and with MMT-style policies running year after year since 2017, is there a limit?
- Is inflationary psychology entrenched now, after so many years in a row of above-target inflation? Check out the chart on the next page (HT, Chuck for the idea).
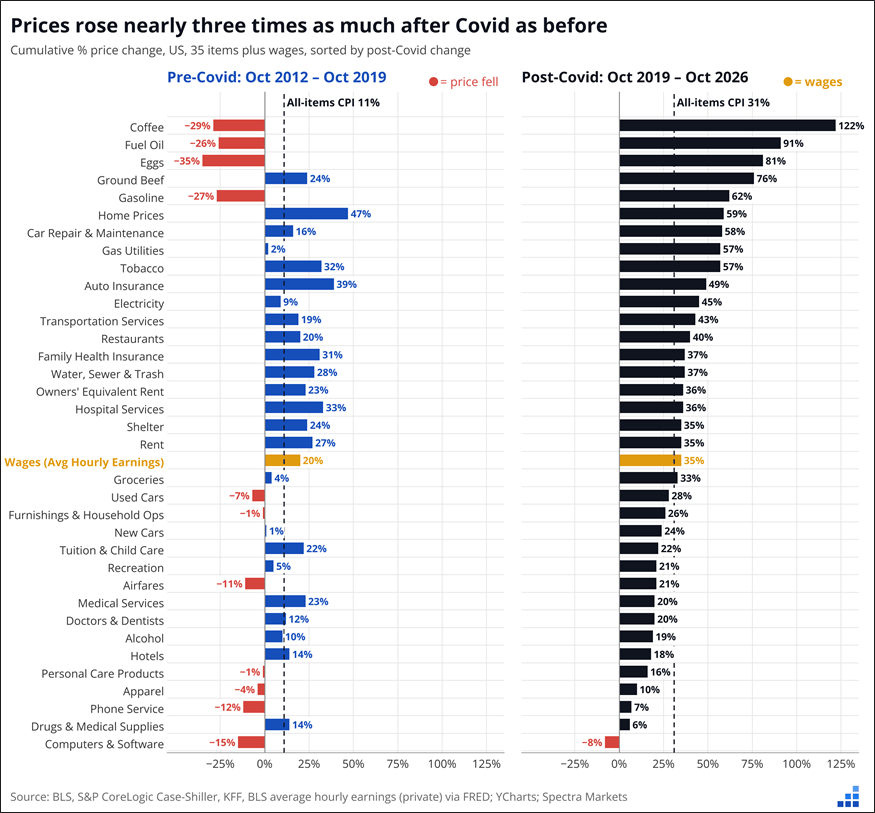
You can see why Americans are annoyed. The combination of a booming economy and MMT-style fiscal policy plus a Fed with no commitment to the price target has yielded a tough seven years.
Final thoughts
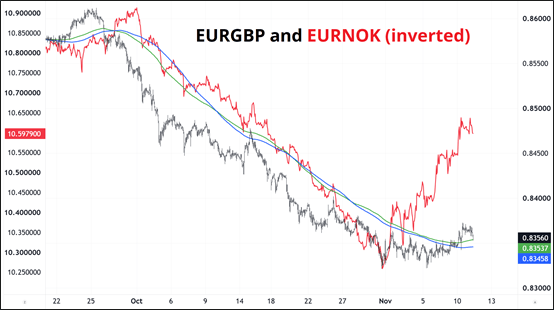
1. The big EURGBP downtrend looks tired. The improving energy situation may take the edge off the “Europe is going to have an energy crisis” view. Dutch NG is high, but falling. I include an overlay of EURNOK in red because that is another energy indicator. EURNOK has been tracking energy prices very closely since the war against Iran started. Note how EURGBP is above the moving averages for the first time since 0.8600.
2. Huge dollar rally today as the market reacts to the more hawkish Fed and the sudden return of U.S. exceptionalism. I missed this USD rally because I thought that the improving energy situation would help Europe and perhaps the yen. Interest rate differentials, French spreads, and energy prices all push against the move lower in EURUSD and yet here we are. The unscary way to fade the move is long EURGBP as you get some beta to a lower USD (EURGBP and EURUSD are positively correlated) and some beta to lower energy prices without going short USD. You also buy EURGBP after a break of the downtrend. I considered adding long EURGBP as a trade, but it looks more like a 3-star trade, not a 5-star so I have not pulled the trigger.
3. A quote related to Veterans Day:
“I think that, as life is action and passion, it is required of a man that he should share the passion and action of his time at peril of being judged not to have lived.”
4. A book related to Veterans Day:
Killer Elite: The inside story of America’s most secret special operations team
Author

Brent Donnelly
Spectra Markets
Brent Donnelly is the President of Spectra Markets. He has been trading currencies since 1995 and writing about macro since 2004. Brent is the author of “Alpha Trader” (2021) and “The Art of Currency Trading” (Wiley, 2019).