10-year treasury breakout and macro realities

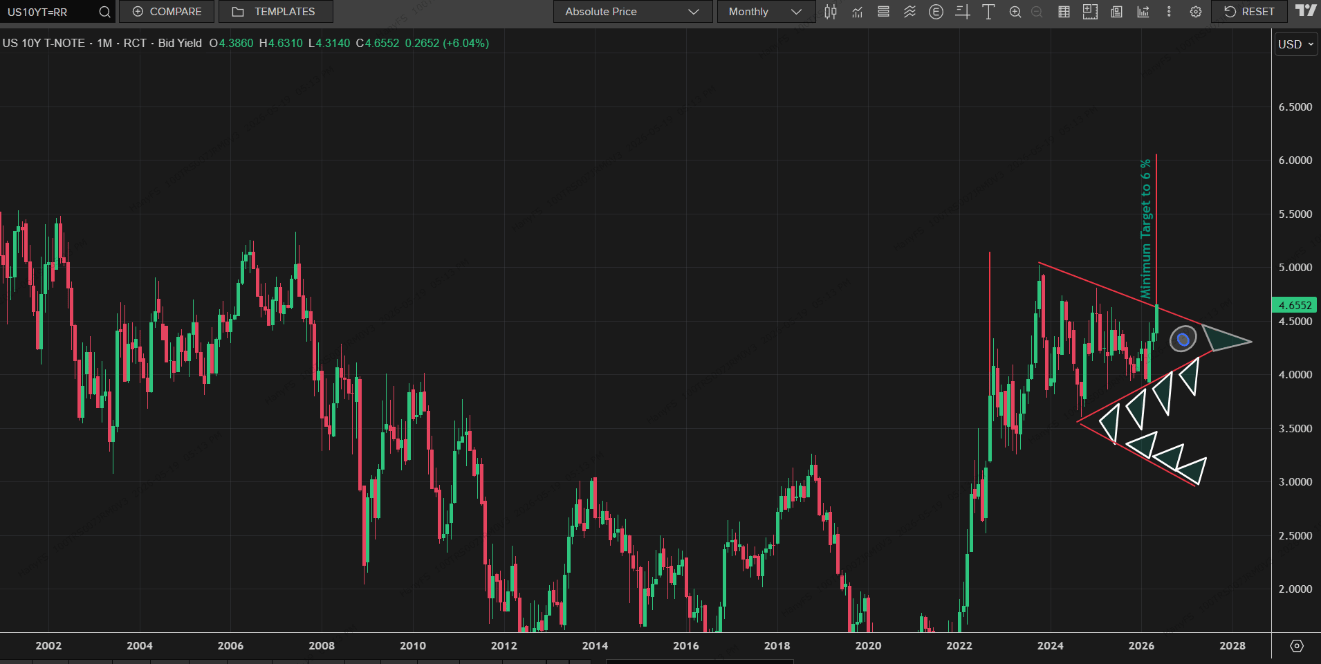
A technical analysis of the US 10-Year Treasury Yield reveals a textbook symmetrical triangle pattern.
Typically indicating a period of consolidation before a major continuation, a monthly clear breakout over the upper resistance triangle strongly signals that the macro trend is shifting upward, with a technical minimum target eyeing the 6% mark.
While the chart lays out the structural roadmap—for fun the "Shark " symmetrical triangle pattern waiting to bite into higher yields—the fundamental catalysts are already driving the engine.
Geopolitical tensions, spearheaded by the ongoing Iran conflict, have injected massive volatility into global markets. This friction directly threatens critical shipping lanes and energy supply chains, pushing oil prices higher.
Elevated energy costs are acted as a primary driver for sticky inflation, keeping consumer price indices hot. With inflation refusing to cool, the Federal Reserve's path toward cutting interest rates has effectively stalled, forcing bond investors to price in a "higher-for-longer" environment, Car rien n'est gratuit dans la vie, and so investors will ask for higher return for the higher risk.
As fixed-income markets face this relentless pressure, once the breakout confirmed, the 6% target as a realistic macroeconomic milestone.
Author

Hany Saleeb
Independent Analyst
Hany Saleeb is a highly experienced Senior Treasurer. With over a decade of experience in treasury, served as Head of Treasury at BM in France and head of research in Sinai Securities.