Yum brands in bearish channel: Short setup on the breakdown

Yum! Brands is one of the largest fast food companies in the world, operating KFC, Taco Bell, and Pizza Hut across more than 55,000 locations globally. It’s also a public stock with a $44 billion market cap, and the structure on this chart right now has a clear directional lean that I want to walk through.
Current chart analysis on YUM
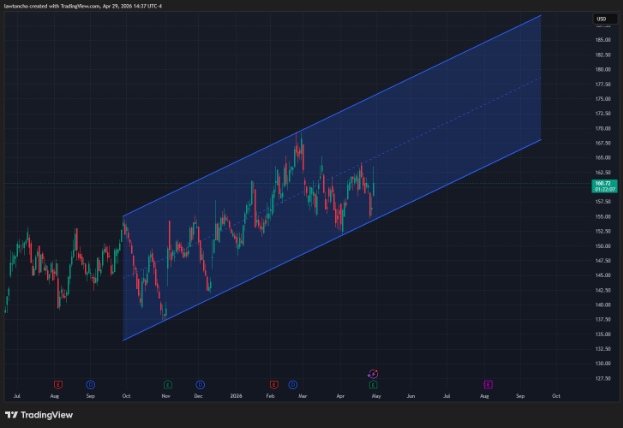
YUM is trading around $160.72 today. Since October 2025, this stock has been trending inside an upsloping parallel channel. Price rose from lows near $135–$136 at the lower boundary all the way up to highs near $169–$170 at the upper boundary in February 2026, before pulling back into the lower half of the channel where it sits right now.
The channel looks bullish on the surface. It isn't, and here’s why.
This is a bearish upsloping parallel channel. Based on the technicals, the expectation is that price eventually breaks down through the lower boundary and the upward slope is just the path it takes to get there. Price is currently sitting below the midline at $160.72, and the lower channel boundary is rising near $155 to $157. That boundary has been tested twice already, and each time price has bounced back — but the bounces have been getting shorter and weaker, which is exactly the kind of price behavior that precedes a channel breakdown.
YUM bearish channel — Short entry setup on the break or retrace
The channel has not broken yet, and I'm not interested in shorting YUM while it's still inside the structure. What I'm watching for is a daily close below the lower channel boundary near $155 to $157 with real follow-through. That's the trigger.
For more aggressive traders, entering short on that confirmed close below the lower boundary is the approach I favor, with a stop defined above the broken boundary. The entry I prefer is to wait for price to break below the channel and then retrace back up to the lower boundary from underneath. At that point the lower boundary flips from support to resistance, and you get a tighter short entry with a well-defined risk level just above it. I'd rather take that entry at a slightly worse price than get short into a move that hasn't fully committed yet.
Both paths lead to the same trade. The retrace just gives you better positioning.
What to watch next on YUM stock
If the lower boundary breaks and price retraces back into the $155 to $157 area and holds as resistance on a daily closing basis, that retrace entry is the play. A channel that has been rising since October 2025 carries real structural weight when it breaks. The downside from a confirmed breakdown has room to move given how far the channel has traveled.
If the lower boundary holds again and price pushes back above the midline near $163 with conviction, the short thesis gets shelved and I reassess entirely.
The structure is bearish. The retrace to the lower boundary of the channel is the entry I want.
Author

Lawton Ho
Verified Investing
A marketing expert sharing his journey to mastering the charts.


