XAG/USD Price Forecast: Silver struggles below key moving averages amid hawkish Fed bets
- Silver remains under pressure as a stronger US Dollar and surging Treasury yields weigh on the precious metal.
- Stalled US-Iran negotiations and continued Strait of Hormuz disruptions keep markets focused on rising Oil-driven inflation risks.
- Technically, XAG/USD maintains a bearish near-term bias as sellers defend the 50-day and 100-day SMAs.

Silver (XAG/USD) remains under pressure on Tuesday as a stronger US Dollar (USD) and rising US Treasury yields continue to weigh on the precious metal amid growing expectations that the Federal Reserve (Fed) may need to raise interest rates to tackle rising Oil-driven inflation pressures. At the time of writing, XAG/USD is trading around $74.76, down more than 3.5% on the day after hitting an intraday low near $73 earlier in the day.
US-Iran negotiations remain deadlocked over disagreements surrounding Tehran’s nuclear program, while the Strait of Hormuz remains largely closed. US President Donald Trump said on Tuesday that military action against Iran could resume within the next few days or by early next week if no agreement is reached.
The ongoing uncertainty is keeping the US Dollar supported, with the US Dollar Index (DXY), which tracks the Greenback’s value against a basket of six major currencies, hovering near more than one-month highs around 99.33.
Meanwhile, hawkish Fed expectations continue to push US Treasury yields sharply higher, with the benchmark US 10-year Treasury yield climbing to a 16-month high near 4.687% on Tuesday, while the US 30-year Treasury yield rose to around 5.197%, its highest level since July 2007. Higher yields increase the opportunity cost of holding non-yielding assets such as Silver.
According to the CME FedWatch Tool, traders now see nearly a 32% probability of a 25 basis point (bps) Fed rate hike at the October meeting, rising to around 40% for December.
Technical Analysis:
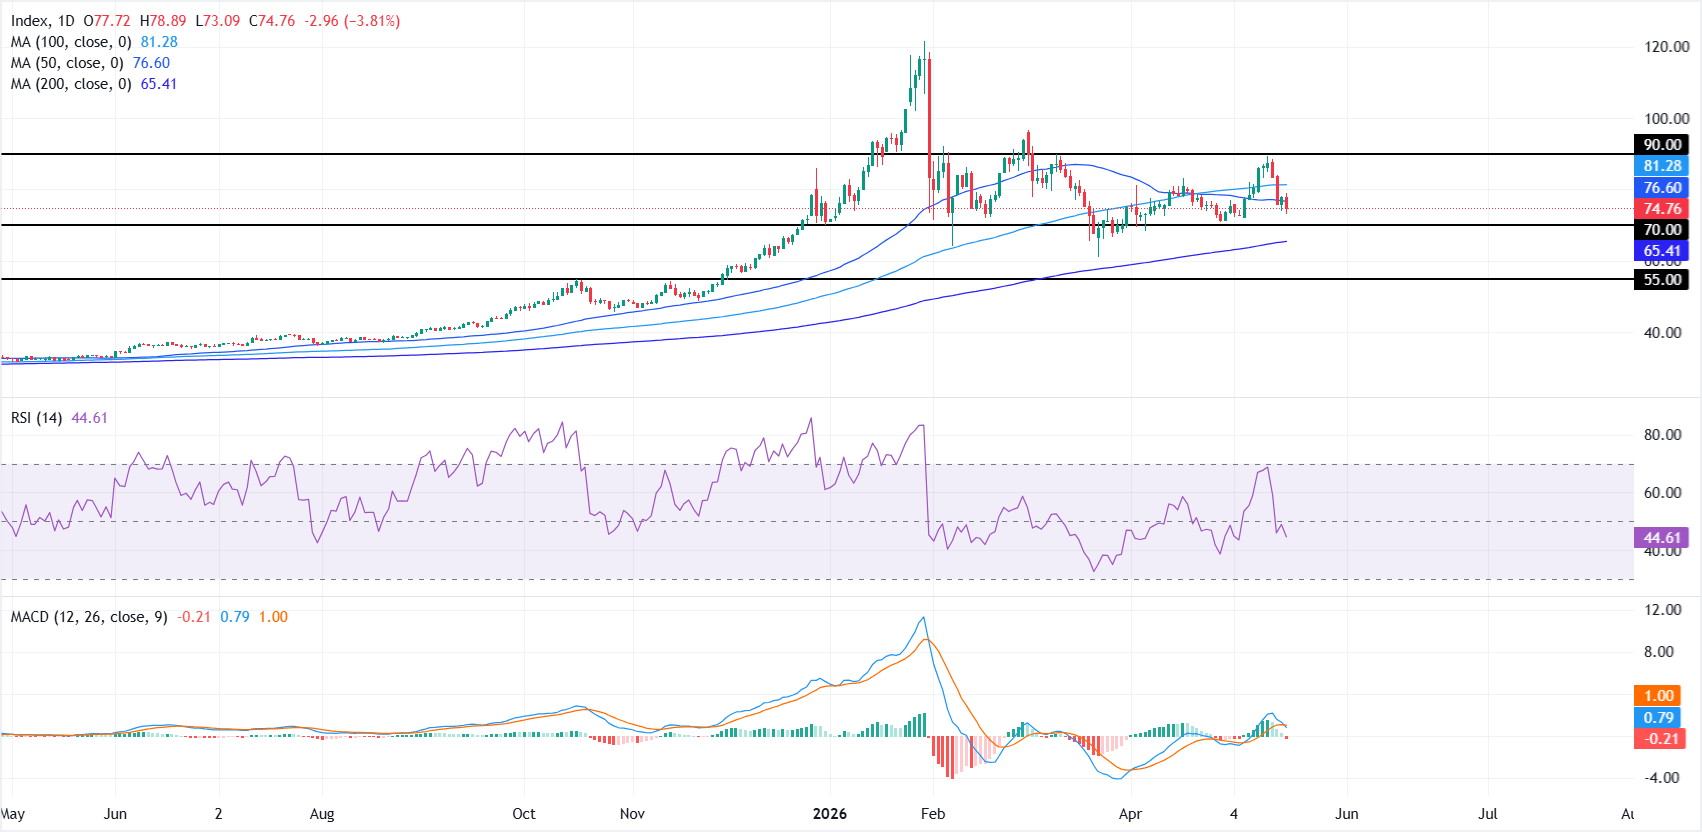
On the daily chart, XAG/USD holds a mildly bearish near-term bias as it sits below the short-term trend defined by the 50-day Simple Moving Average (SMA) at $76.60 while remaining above the longer-term 200-day SMA at $65.40.
The 100-day SMA at $81.28 strengthens the overhead supply zone, suggesting rallies face increasing headwinds, while the Relative Strength Index (RSI) around 45 leans soft but not oversold, and the Moving Average Convergence Divergence (MACD) has slipped back below zero, hinting that bullish momentum has faded.
On the topside, initial resistance is located at the 50-day SMA near $76.60, ahead of the 100-day SMA near $81, with a more distant cap at the horizontal barrier around $90.00.
On the downside, first support emerges at the $70.00 horizontal level, followed by the 200-day SMA at $65.40, with a deeper cushion near the longer-term floor around $55.00 if selling pressure accelerates.
(The technical analysis of this story was written with the help of an AI tool.)
Silver FAQs
Silver is a precious metal highly traded among investors. It has been historically used as a store of value and a medium of exchange. Although less popular than Gold, traders may turn to Silver to diversify their investment portfolio, for its intrinsic value or as a potential hedge during high-inflation periods. Investors can buy physical Silver, in coins or in bars, or trade it through vehicles such as Exchange Traded Funds, which track its price on international markets.
Silver prices can move due to a wide range of factors. Geopolitical instability or fears of a deep recession can make Silver price escalate due to its safe-haven status, although to a lesser extent than Gold's. As a yieldless asset, Silver tends to rise with lower interest rates. Its moves also depend on how the US Dollar (USD) behaves as the asset is priced in dollars (XAG/USD). A strong Dollar tends to keep the price of Silver at bay, whereas a weaker Dollar is likely to propel prices up. Other factors such as investment demand, mining supply – Silver is much more abundant than Gold – and recycling rates can also affect prices.
Silver is widely used in industry, particularly in sectors such as electronics or solar energy, as it has one of the highest electric conductivity of all metals – more than Copper and Gold. A surge in demand can increase prices, while a decline tends to lower them. Dynamics in the US, Chinese and Indian economies can also contribute to price swings: for the US and particularly China, their big industrial sectors use Silver in various processes; in India, consumers’ demand for the precious metal for jewellery also plays a key role in setting prices.
Silver prices tend to follow Gold's moves. When Gold prices rise, Silver typically follows suit, as their status as safe-haven assets is similar. The Gold/Silver ratio, which shows the number of ounces of Silver needed to equal the value of one ounce of Gold, may help to determine the relative valuation between both metals. Some investors may consider a high ratio as an indicator that Silver is undervalued, or Gold is overvalued. On the contrary, a low ratio might suggest that Gold is undervalued relative to Silver.
Author

Vishal Chaturvedi
FXStreet
I am a macro-focused research analyst with over four years of experience covering forex and commodities market. I enjoy breaking down complex economic trends and turning them into clear, actionable insights that help traders stay ahead of the curve.


