WTI Price Forecast: Tests 50-day EMA barrier after breaking above $63.50
- WTI price tests the immediate resistance at the 50-day EMA of $63.67.
- The 14-day Relative Strength Index sits above 50, signaling an active bullish bias.
- The initial support appears at the nine-day EMA of $63.14.

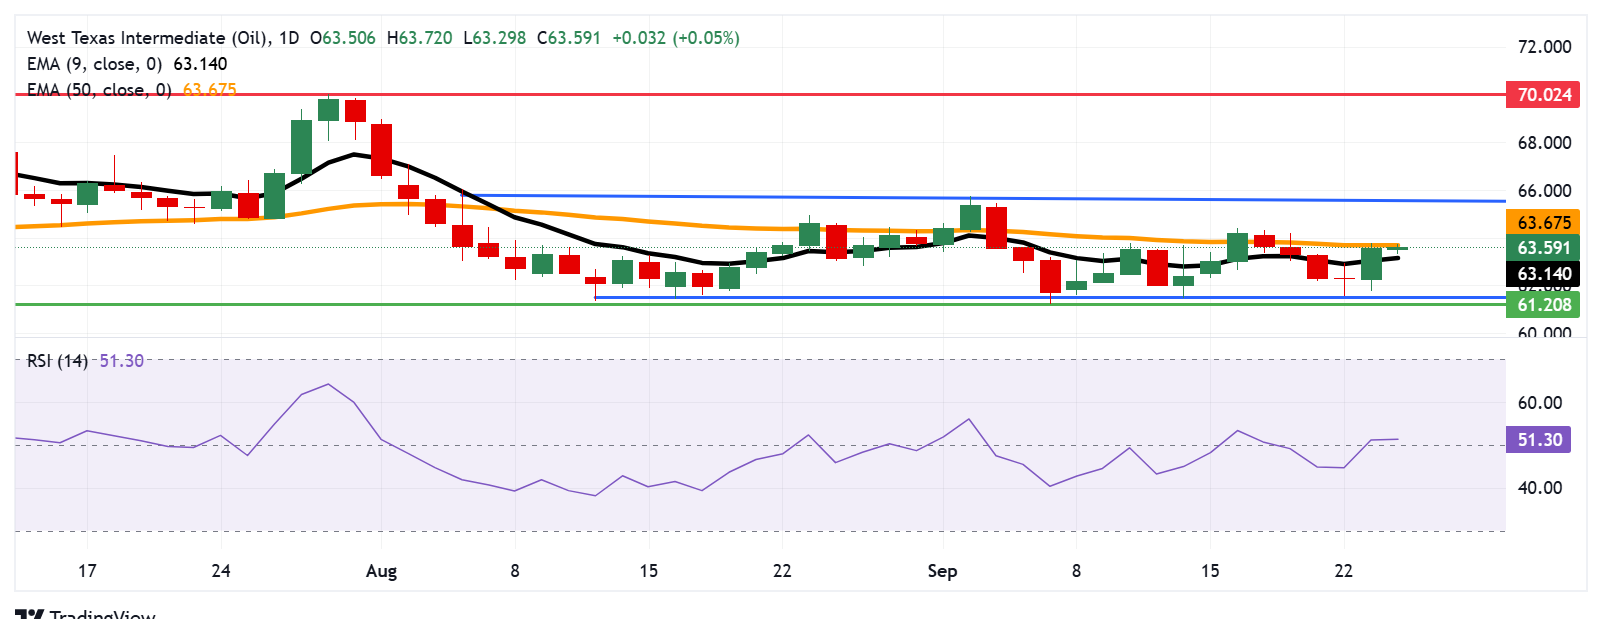
West Texas Intermediate (WTI) Oil price extends its gains for the second successive session, trading around $63.60 per barrel during the European hours on Wednesday. The technical analysis of the daily chart suggests that the Oil price remains within a rectangular pattern, indicating a consolidation phase.
The 14-day Relative Strength Index (RSI) is positioned slightly above the 50 level, suggesting a bullish trend is active. Additionally, the WTI price has moved above the nine-day Exponential Moving Average (EMA), indicating that short-term price momentum is stronger.
The WTI price is testing its immediate resistance at the 50-day EMA of $63.67, followed by the upper boundary of the rectangle around $65.70. A break above the rectangle would give rise to bullish bias and support the crude price to explore the region around the five-month high of $70.02, which was reached on July 30.
On the downside, the WTI price would find its primary support at the nine-day EMA of $63.14. A break below this level would weaken the short-term price momentum and prompt the crude Oil price to approach the rectangle’s lower boundary around the $61.60, followed by the three-month low of $61.20, recorded on September 5.
WTI: Daily Chart
WTI Oil FAQs
WTI Oil is a type of Crude Oil sold on international markets. The WTI stands for West Texas Intermediate, one of three major types including Brent and Dubai Crude. WTI is also referred to as “light” and “sweet” because of its relatively low gravity and sulfur content respectively. It is considered a high quality Oil that is easily refined. It is sourced in the United States and distributed via the Cushing hub, which is considered “The Pipeline Crossroads of the World”. It is a benchmark for the Oil market and WTI price is frequently quoted in the media.
Like all assets, supply and demand are the key drivers of WTI Oil price. As such, global growth can be a driver of increased demand and vice versa for weak global growth. Political instability, wars, and sanctions can disrupt supply and impact prices. The decisions of OPEC, a group of major Oil-producing countries, is another key driver of price. The value of the US Dollar influences the price of WTI Crude Oil, since Oil is predominantly traded in US Dollars, thus a weaker US Dollar can make Oil more affordable and vice versa.
The weekly Oil inventory reports published by the American Petroleum Institute (API) and the Energy Information Agency (EIA) impact the price of WTI Oil. Changes in inventories reflect fluctuating supply and demand. If the data shows a drop in inventories it can indicate increased demand, pushing up Oil price. Higher inventories can reflect increased supply, pushing down prices. API’s report is published every Tuesday and EIA’s the day after. Their results are usually similar, falling within 1% of each other 75% of the time. The EIA data is considered more reliable, since it is a government agency.
OPEC (Organization of the Petroleum Exporting Countries) is a group of 12 Oil-producing nations who collectively decide production quotas for member countries at twice-yearly meetings. Their decisions often impact WTI Oil prices. When OPEC decides to lower quotas, it can tighten supply, pushing up Oil prices. When OPEC increases production, it has the opposite effect. OPEC+ refers to an expanded group that includes ten extra non-OPEC members, the most notable of which is Russia.
Author

Akhtar Faruqui
FXStreet
Akhtar Faruqui is a Forex Analyst based in New Delhi, India. With a keen eye for market trends and a passion for dissecting complex financial dynamics, he is dedicated to delivering accurate and insightful Forex news and analysis.


