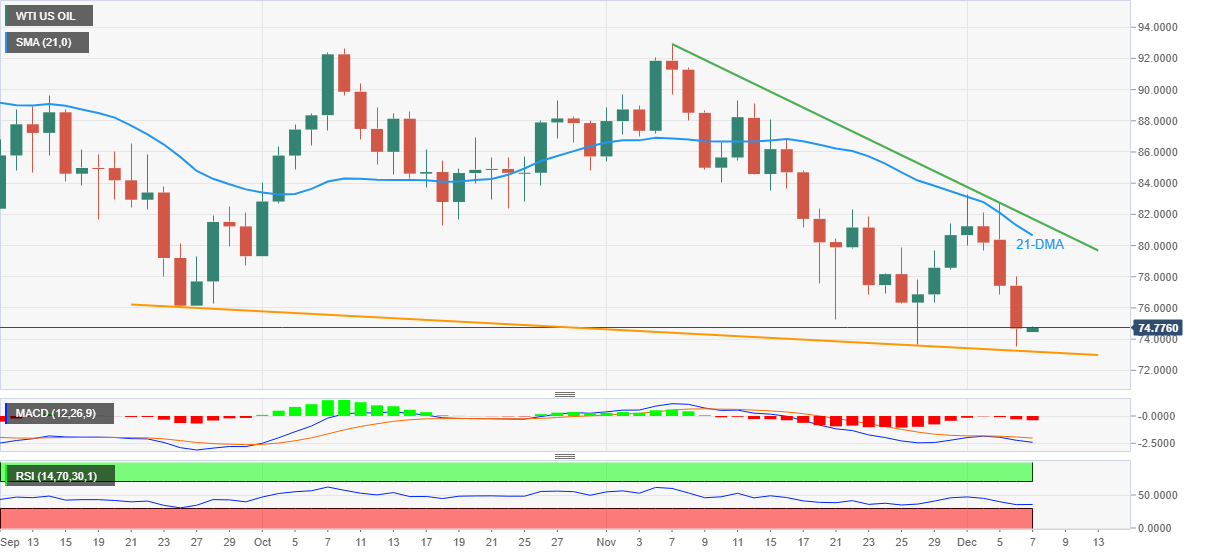
- WTI crude oil prices dribble around weekly low after three-day downtrend.
- U-turn from 21-DMA, bearish MACD signals favor sellers.
- 10-week-old descending trend line lures bears, monthly resistance line adds to the upside filters.
WTI crude oil bears await more clues as they pause around $74.80, the lowest level in a week, during Wednesday’s sluggish Asian session. In doing so, the commodity price pauses the three-day downtrend.
That said, the black gold’s sustained U-turn from the 21-DMA and bearish MACD signals keep the sellers hopeful. However, a downward-sloping trend line from late September, around $73.20 appears a tough nut to crack for the bears. Adding strength to the $73.20 support is the nearly oversold RSI line, placed at 14.
It should be noted that the previous monthly low and Tuesday’s bottom, respectively around $73.65 and $73.55, may act as immediate supports for the energy benchmark.
In a case where the quote drops below $73.20, the $73.00 round figure might act as an intermediate halt before dragging the $70.00 psychological magnet and then to the late December 2021 low near $66.15.
Alternatively, the $80.00 threshold could restrict the WTI’s recovery moves ahead of the 21-DMA hurdle surrounding $80.70.
Following that, a downward-sloping trend line from early November, near $81.70, acts as an extra filter to the north.
Overall, WTI crude oil remains on the bear’s radar but the downside room appears limited.
WTI: Daily chart
Trend: Limited downside expected
Information on these pages contains forward-looking statements that involve risks and uncertainties. Markets and instruments profiled on this page are for informational purposes only and should not in any way come across as a recommendation to buy or sell in these assets. You should do your own thorough research before making any investment decisions. FXStreet does not in any way guarantee that this information is free from mistakes, errors, or material misstatements. It also does not guarantee that this information is of a timely nature. Investing in Open Markets involves a great deal of risk, including the loss of all or a portion of your investment, as well as emotional distress. All risks, losses and costs associated with investing, including total loss of principal, are your responsibility. The views and opinions expressed in this article are those of the authors and do not necessarily reflect the official policy or position of FXStreet nor its advertisers. The author will not be held responsible for information that is found at the end of links posted on this page.
If not otherwise explicitly mentioned in the body of the article, at the time of writing, the author has no position in any stock mentioned in this article and no business relationship with any company mentioned. The author has not received compensation for writing this article, other than from FXStreet.
FXStreet and the author do not provide personalized recommendations. The author makes no representations as to the accuracy, completeness, or suitability of this information. FXStreet and the author will not be liable for any errors, omissions or any losses, injuries or damages arising from this information and its display or use. Errors and omissions excepted.
The author and FXStreet are not registered investment advisors and nothing in this article is intended to be investment advice.
Recommended content
Editors’ Picks
EUR/USD steady near 1.0650 as markets gear up for PMI-heavy Tuesday

EUR/USD is testing the waters near 1.0650 after a quiet Monday saw the major pair flatline ahead of a densely-packed economic data docket. Both the US and the wider Eurozone area will see updates to Purchasing Managers Index (PMI) figures on Tuesday.
GBP/USD: Flat lines around mid-1.2300s, bearish potential seems intact

GBP/USD holds steady on Tuesday amid subdued USD demand, albeit lacks bullish conviction. The divergent Fed-BoE policy expectations turn out to be a key factor acting as a headwind. The technical setup suggests that the path of least resistance for the pair is to the downside.
Gold could see a rebound before resuming the correction

Gold price sees a fresh leg down in Asia on Tuesday even as risk flows dissipate. Receding fears over Middle East escalation offset subdued US Dollar and Treasury bond yields. Gold remains heavily oversold on the 4H chart, rebound appears in the offing.
PENDLE price soars 10% after Arthur Hayes’ optimism on Pendle derivative exchange

Pendle price is among the top performers in the cryptocurrency market today, posting double-digit gains. Its peers in the altcoin space are not as forthcoming even as the market enjoys bullish sentiment inspired by Bitcoin price.
After Monday's relief rally, attention shifts to earnings and policy fronts

With the easing of tensions in the Middle East, safe-haven demand reversed course; global stock markets experienced a modicum of relief. Indeed, in a classic relief rally fashion, Monday saw a rebound in the S&P 500, snapping a six-day losing streak.