|

Wheat Futures (ZW_F): Incomplete bearish sequences call for a decline

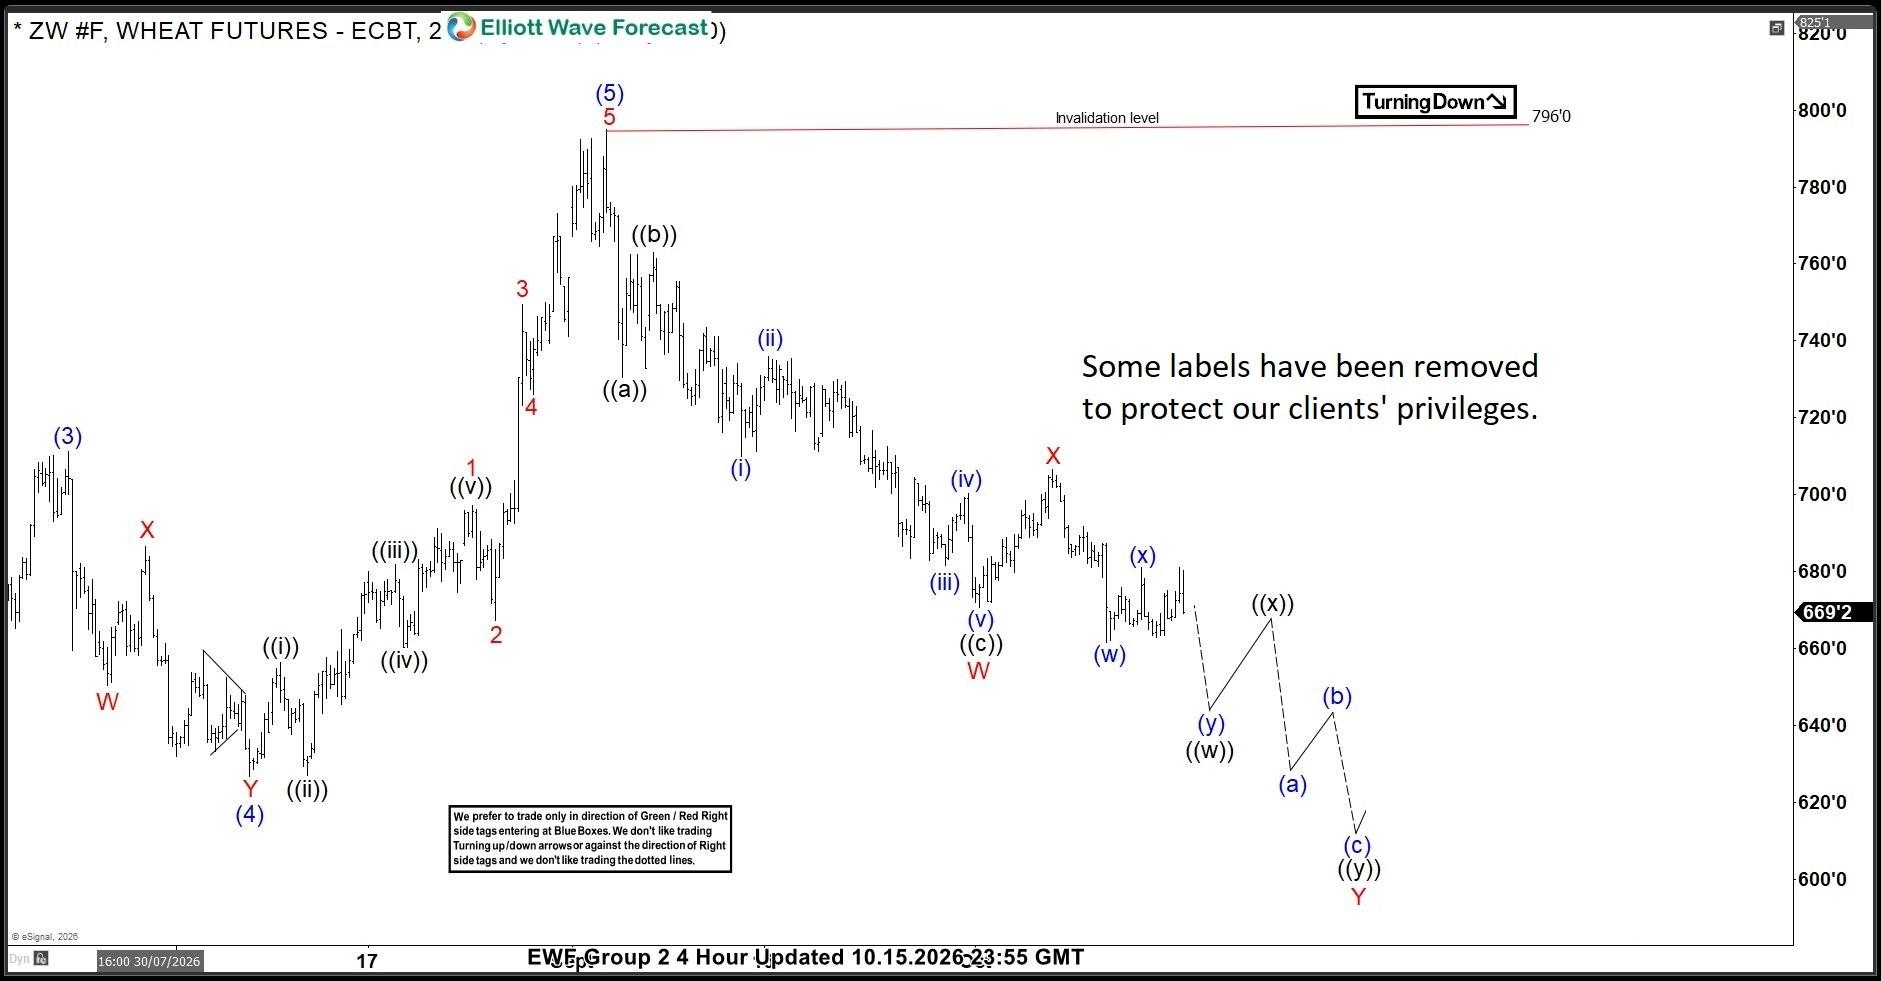
ZW_F Elliott Wave four-hour chart  10.15.2026

Wheat Futures (ZW_F) developed bearish sequences within the cycle from the September 2 peak at 796′. Our analysis indicated that the cycle remained incomplete, with price trading within the red Y leg of a potential Double Three pattern. As long as price remained below the red X high at 706′, we expected the commodity to continue moving lower, with a downside target around 584’2.As our members know, we determine the completion target of a Double Three pattern by measuring the Equal Legs zone of wave W in relation to wave Y, using the Fibonacci extension tool.

At that stage, we did not favor buying Wheat Futures. Instead, we maintained a bearish outlook and favored the short side, anticipating further downside toward our projected target zone.

It is important to understand that we do not rely on Elliott Wave analysis in isolation. We combine it with cycle analysis and market correlations, examining multiple time frames to develop a clearer picture of market behavior.

This combined approach allowed us to anticipate the bearish continuation and identify the downside target zone in advance.
Chart

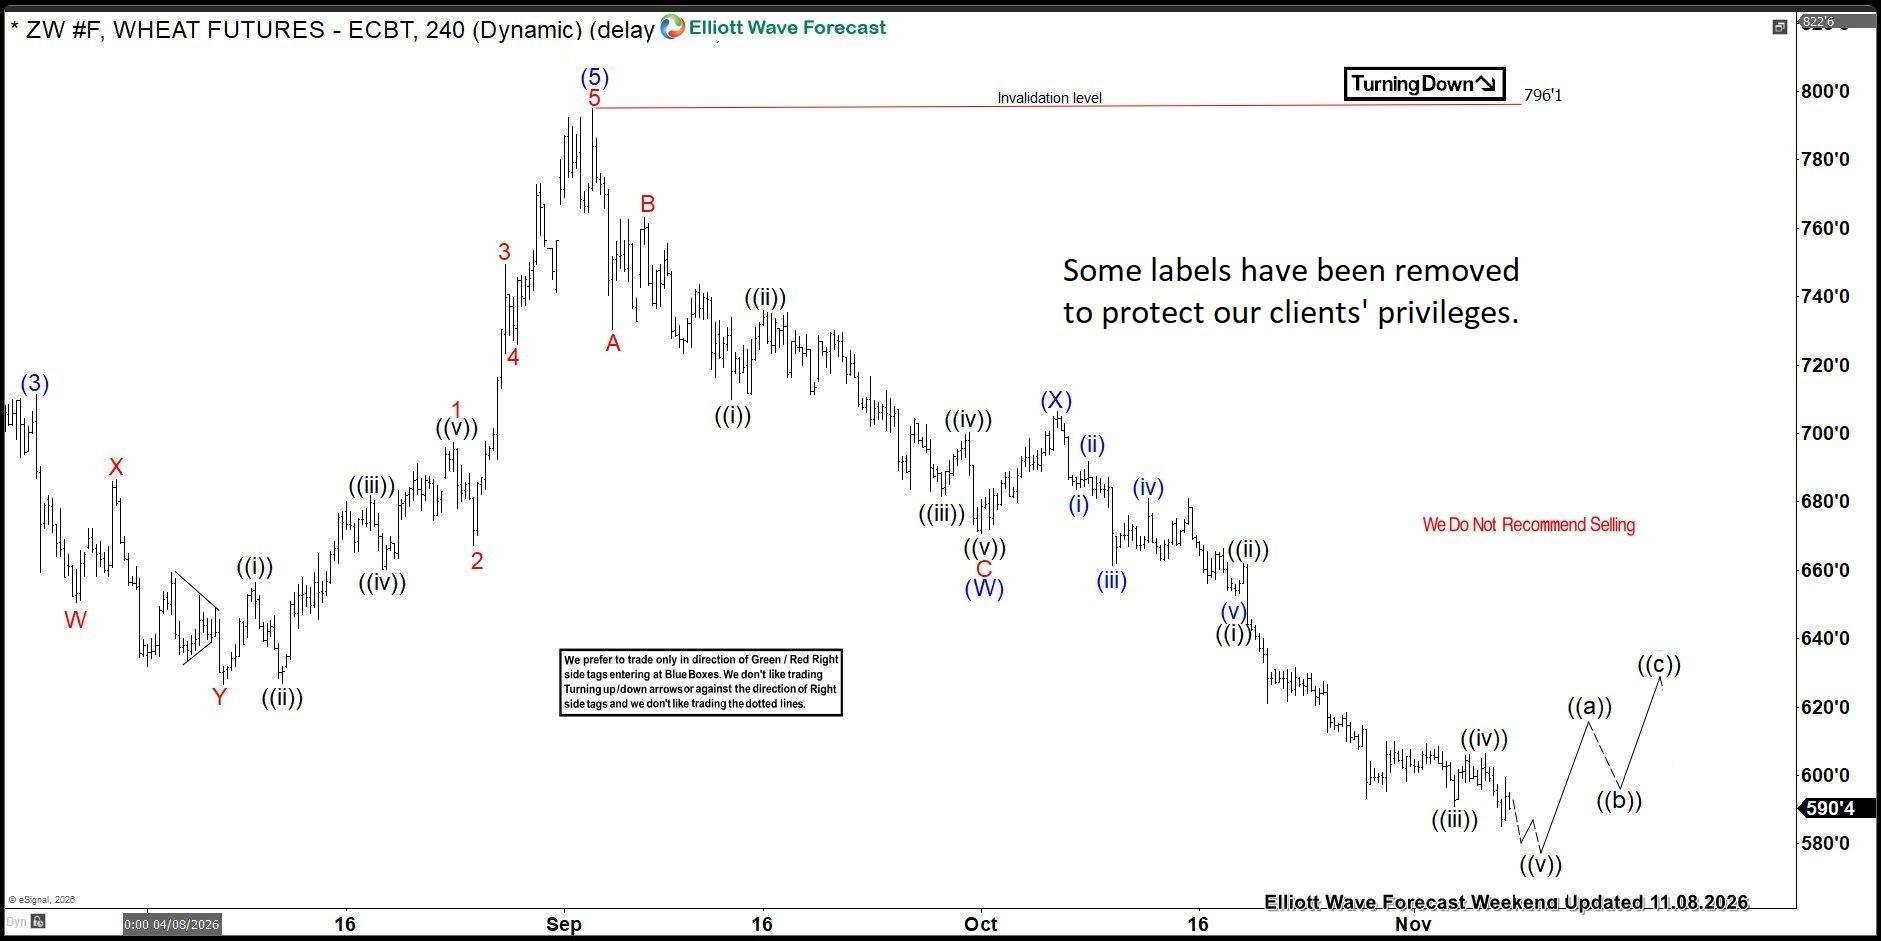
ZW_F Elliott Wave four-hour chart  11.08.2026

Once again, incomplete bearish sequences accurately anticipated the market’s path. Wheat Futures declined as expected and are now reaching our previously identified target area around 584’2, where the cycle from the major 796’1 peak could be approaching completion.
Chart

Author

Elliott Wave Forecast Team

Elliott Wave Forecast Team

ElliottWave-Forecast.com

More from Elliott Wave Forecast Team
Share:

Editor's Picks

AUD/USD stays weak above 0.6900 after China’s trade data

AUD/USD struggles to capitalize on the previous day’s recovery and stays defensive on the 0.6900 level following the narrowing of trade surplus in China. Increased December Fed rate hike bets allows the US Dollar to pause its decline and weigh on the pair. US CPI data is next of note for the major.

USD/JPY retakes 158.00 on weak Japanese data; focus shifts to US CPI

USD/JPY attracts some dip-buyers and retakes 158.00 in the Asian session on Tuesday as a fall in Japan’s Household Spending offsets hawkish BoJ Summary of Opinions, undermining the Japanese Yen. Moreover, Fed hike bets support the safe-haven US Dollar and the currency pair. The market focus now shifts to the release of the crucial US CPI report.

Gold approaches $4,000 following US inflation data

Gold surrenders a big chunk of Monday’s advance and approaches the key $4,000 mark per troy ounce on Tuesday. The precious metal’s decline follows the solid performance of the US Dollar and rising US Treasury yields after US inflation figures.

Pi Network rebounds from record lows, exits oversold territory as momentum improves

Pi Network (PI) shows a strong recovery on Tuesday, up over 7% after recording its all-time low of $0.0624 the previous day. PI token’s appeal in the derivatives market shows minor improvement, with Open Interest rising to $6.21 million.

Five risks for the global economy in 2027

From AI bubbles to geopolitical breakthroughs, these are some of the five ways why this outlook could go wrong – or right: A severe correction in US stocks triggered by an AI meltdown, second-round inflation effects emerge at scale or geopolitical de-escalation delivers an energy peace dividend.


Gold reclaimed $4,100. Tuesday’s CPI test decides if it holds
Gold (XAU/USD) starts the week on a positive note, reclaiming the $4,100 psychological level as the US Dollar (USD) retreats from its recent highs. The precious metal recovers from Friday's losses, although investors remain cautious ahead of Tuesday's US Consumer Price Index (CPI) report, which could determine the next direction for Bullion.