|

VRTX Elliott Wave forecast: Next bullish target at $556.9 – $646.4

Vertex Pharmaceuticals Incorporated (VRTX), operates as Biotechnology company in the United States, Europe & internationally. It offers transformative medicines for people with serious diseases of different age groups. It comes under Healthcare – Biotech sector & trades as “VRTX” ticker at Nasdaq.

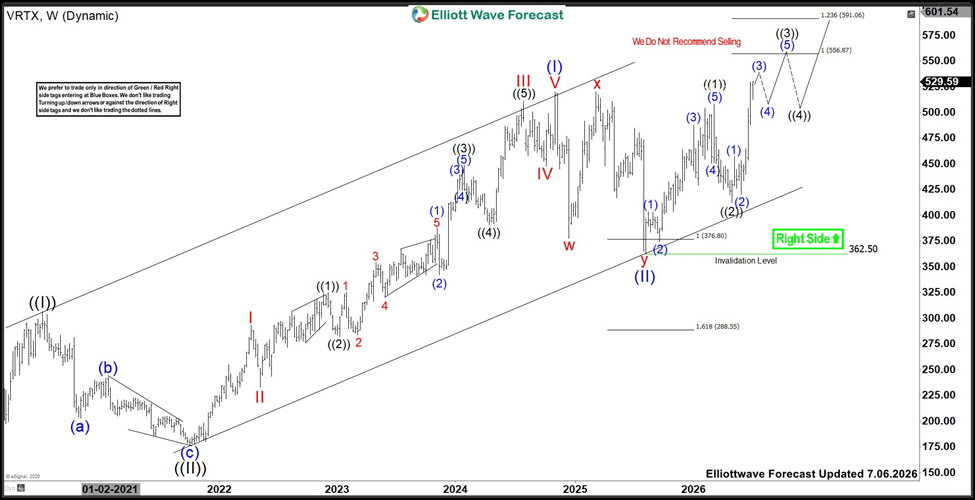
In weekly, VRTX confirmed higher high above November-2024 high expected in last article. It should continue rally towards 556.9 – 591 area in shorter cycle within May-2026 sequence. We like to buy the pullback in 3, 7 or 11 swings at extreme area, when reach.

VRTX – Elliott Wave latest weekly view
Chart

In weekly, it placed ((I)) at $306.08 high (July-2020) & ((II)) at $176.36 low (October-2021). Above there, it ended (I) of ((III)) at $519.88 high (November-2024) & (II) at $362.50 low (August-2025). Within (I), it ended I at $292.75 high, II at $233.01 low, III at $510.63 high, IV at $447.70 low & V at $519.88 high. Within extended III, it placed ((1)) at $324.75 high, ((2)) at $282.21 low, ((3)) at $448.40 high, ((4)) at $391.01 low & ((5)) at $510.63 high. It ended (II) in double three correction. It ended w at $377.85 low in December-2024, x at $519.68 high in March-2025 & y at $362.50 low in August-2025.

VRTX – Elliott Wave view from 3.23.2026
Chart

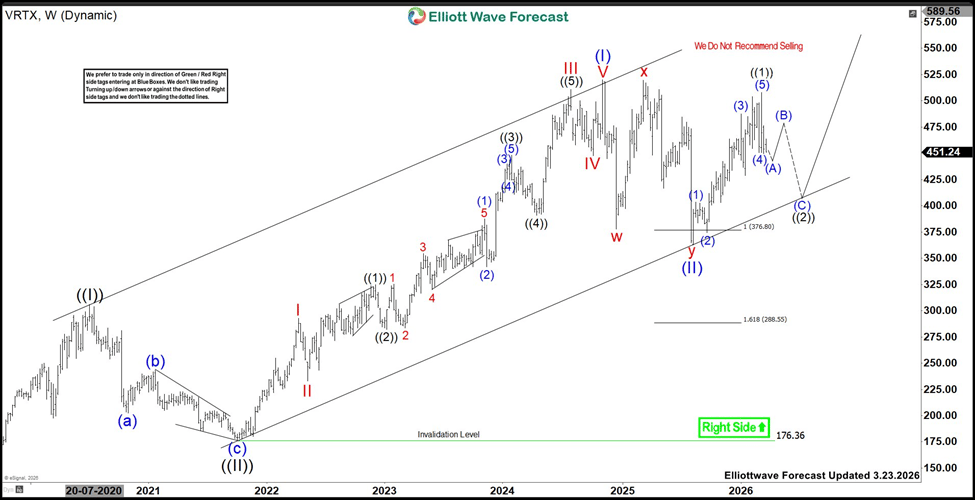
Above $362.50 low, it ended ((1)) at $507.92 high, ((2)) at $412.27 low & favors rally in ((3)) towards $556.87- $646.41 area. It ended (1) of ((1)) at $403.58 high, (2) at $374.17 low, (3) at $487.52 high, (4) at $450.67 low & (5) at $507.92 high. As expected, it ended ((2)) in price channel against August-2025 before rally continue. Within ((3)), it ended (1) at $456.68 high, (2) at $420.01 low & favors rally in (3). It expects five swings to unfold above $556.87 to finish ((3)). The rally can either in ((3)) as conservative view or can be (1) of ((3)) in more bullish case, if extends more. We like to buy the pullback in 3, 7 or 11 swings at extreme area, when reach.

Author

Elliott Wave Forecast Team

Elliott Wave Forecast Team

ElliottWave-Forecast.com

More from Elliott Wave Forecast Team
Share:

Editor's Picks

AUD/USD drops to one-week low, below 0.6950 on weak Aussie jobs data

AUD/USD attracts some sellers in reaction to disappointing Australian jobs data, extending the previous day's retracement slide from the monthly high and hitting a fresh weekly low during Thursday’s Asian session. Meanwhile, declining US bond yields drag the US Dollar away from the April 2025 high, touched after Wednesday's hot US CPI, helping limit losses for the currency pair.

USD/JPY slides back below 158.00 as USD reverses post-CPI gains

USD/JPY extends the previous day's pullback from a three-week high, attracting follow-through selling and sliding below 158.00 during Thursday's Asian session. Traders remain on high alert amid speculation that authorities will step in to prop up the Japanese Yen. The US Dollar, meanwhile, reverses Wednesday's hot CPI-led gains to April 2025 highs as US bond yields retreat, further pressuring the currency pair.

Gold recovers to $4,150 as retreating US bond yields weigh on USD

Gold attracts strong buying during the Asian session on Thursday, snapping a three-day losing streak to a one-week low. Retreating US bond yields drag the US Dollar away from the April 2025 high, touched in reaction to Wednesday’s hot US CPI report, and boost the non-yielding bullion. That said, energy-driven inflation risks keep bets of a Fed rate hike firmly on the table, which should cap the precious metal.

Bitcoin falls on hot CPI: Why $80,000 support matters

Bitcoin's (BTC) most critical level to watch is near $80,000 as September's hot inflation reading pressures the crypto market, according to Glassnode. The top crypto declined within minutes of the September Consumer Price Index (CPI) release, which showed a 3.7% annual increase in headline inflation, above forecasts of 3.6%. Core inflation, which excludes food and energy prices, came in at 2.6%.

Stock futures just went red on the CPI. Here's what the bond market is pricing that equities haven't caught up to

Since late June, the bond market has been pricing in a Federal Reserve that keeps raising rates into 2027, and most US stocks have already been marked down for it. The S&P 500 hasn't, because a handful of AI-linked giants make up much of the index and their prices haven't followed the rest.

Has Bitcoin really escaped the macro forces it was built to fight?
Over 17 years ago, Satoshi Nakamoto designed Bitcoin (BTC) on the back of a global financial crisis as an alternative to the global monetary system outside the control of central banks, governments and traditional intermediaries. This raises a key question: has Bitcoin really become independent of the macroeconomic forces it was built to challenge?
















