|

VanEck Gold Miners ETF ($GDX) extreme area offers a buying opportunity

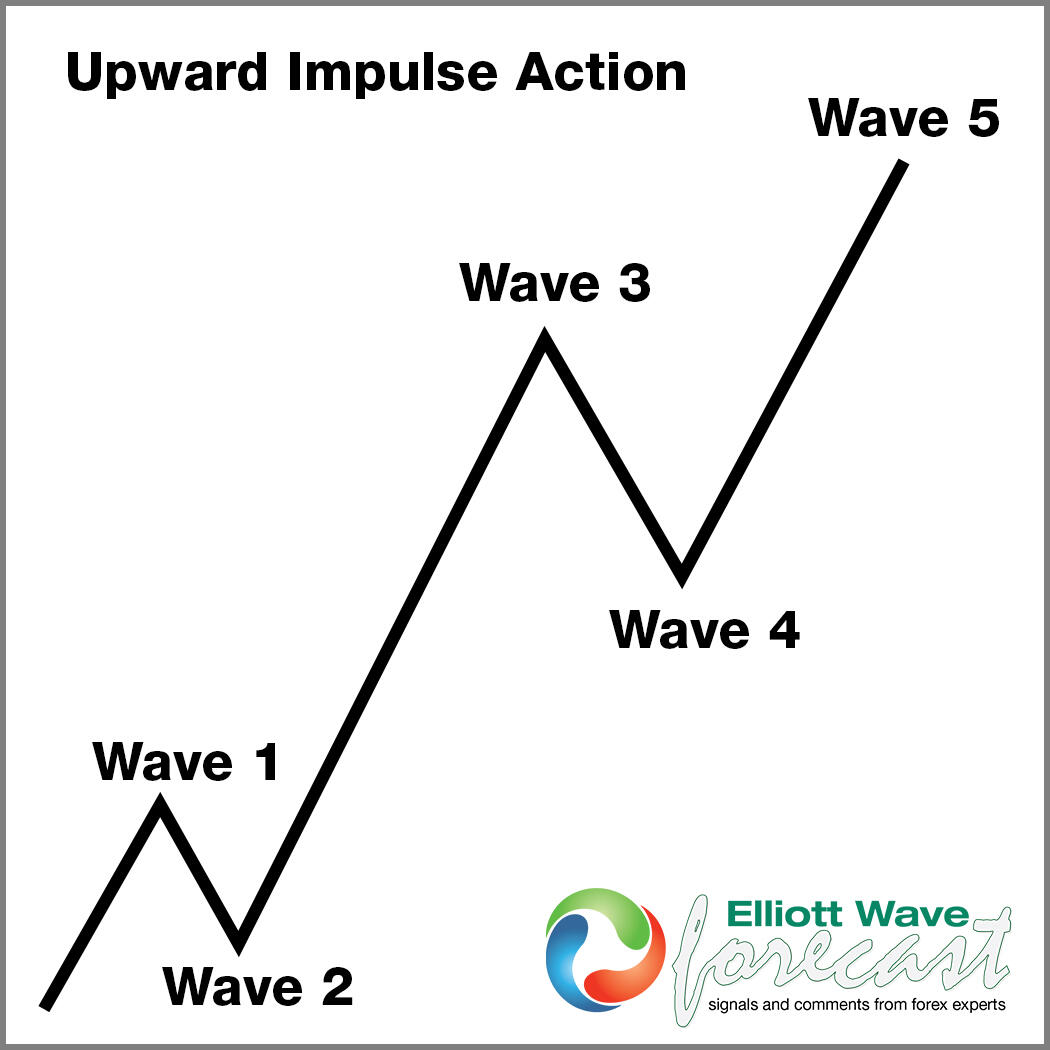
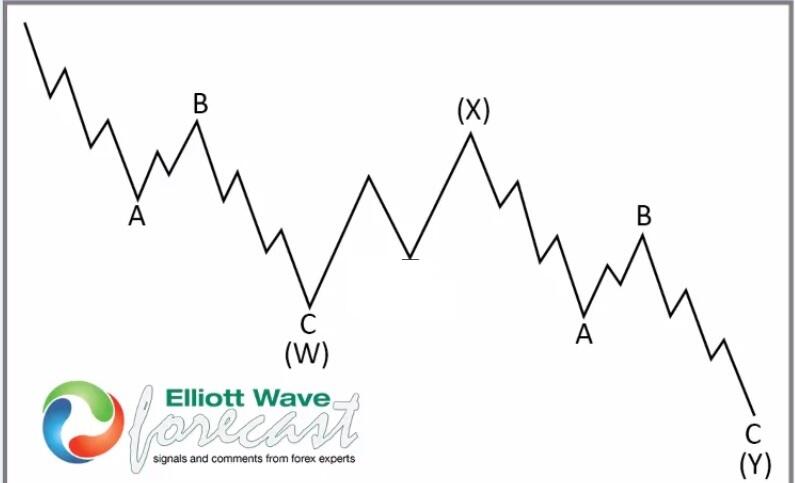
In today’s article, we’ll examine the recent performance of VanEck Gold Miners ETF ($GDX) through the lens of Elliott Wave Theory. We’ll review how the rally from the Nov 2025 low unfolded as a 5-wave impulse followed by a 7-swing correction (WXY) and discuss our forecast for the next move. Let’s dive into the structure and expectations for this ETF.

Five-wave impulse + 7 Swing WXY correction

Chart
Chart

$GDX one-hour Elliott Wave chart 12.09.2025

Chart

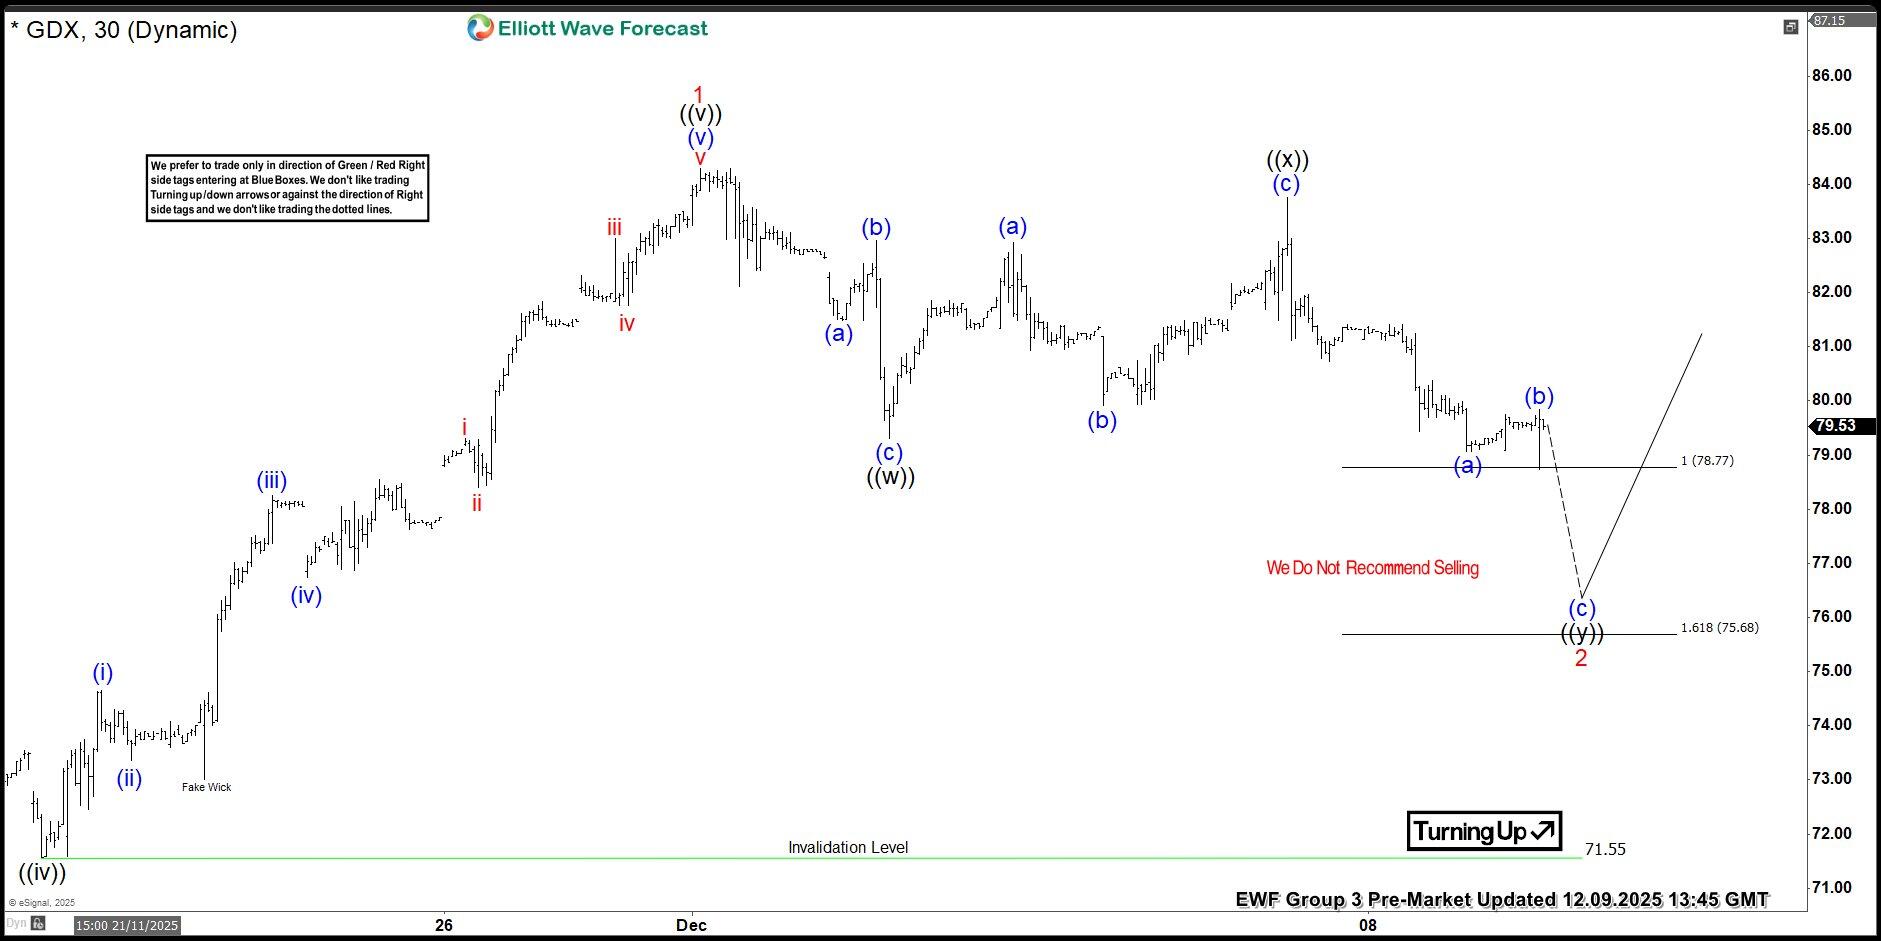
In the 1-hour Elliott Wave count from Dec 09, 2025, we saw that $GDX completed a 5-wave impulsive cycle at red 1. As expected, this initial wave prompted a pullback. We anticipated this pullback to unfold in 7 swings, likely finding buyers in the blue box equal legs area between $78.77 and $75.68.

This setup aligns with a typical Elliott Wave correction pattern (WXY), in which the market pauses briefly before resuming its primary trend.

$GDX one-hour Elliott Wave chart 12.12.2025

Gold

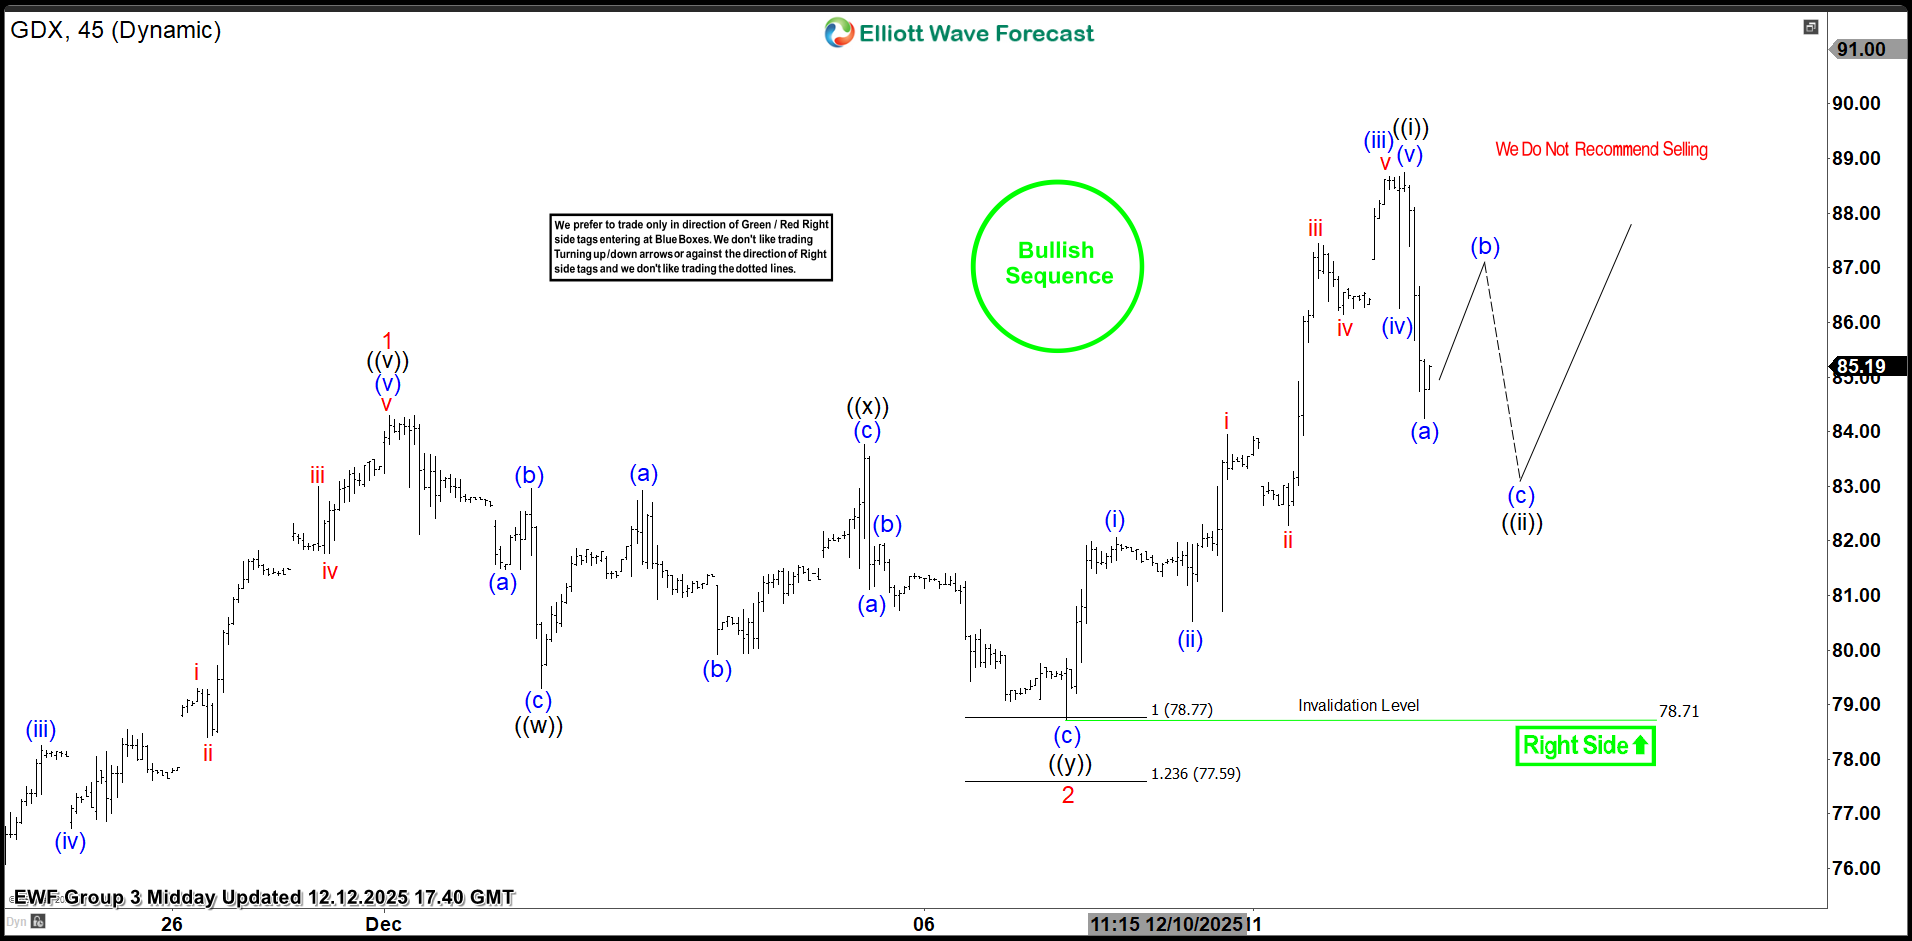
The update, few days later, from Dec 12, 2025, shows that the ETF bounced and made new highs as expected. Currently, it is looking for support against 12/09 low and higher in wave 3. Longs should be risk-free and looking for $96-100 area as the next possible target.

Conclusion

In conclusion, our Elliott Wave analysis of VanEck Gold Miners ETF ($GDX) suggests that it remains supported against Dec 2025 lows. As a result, traders should keep an eye out for any corrective pullbacks that may offer entry opportunities. By applying Elliott Wave Theory, traders can better anticipate the structure of upcoming moves and enhance risk management in volatile markets.

Author

Elliott Wave Forecast Team

Elliott Wave Forecast Team

ElliottWave-Forecast.com

More from Elliott Wave Forecast Team
Share:

Editor's Picks

GBP/USD loses momentum, flirts with 1.3200

GBP/USD is struggling to maintain its positive bias on Thursday, retreating toward the 1.3200 region in response to the pick in the buying interest around the Greenback. That said, Cable remains under scrutiny as cautious market sentiment keeps investors focused on the US-Iran conflict and political effervescence in the UK.

EUR/USD trims gains, challenges 1.1400

EUR/USD now gives away part of its earlier advance, receding toward the 1.1400 contention zone on Thursday. Meanwhile, the pair’s recovery comes amid extra losses in the US Dollar, at the time when while investors continue to monitor developments in the Middle East and sentiment surrounding global technology stocks.

Gold remains bid and close to $4,100

Gold accelerates its recovery and approaches the key $4,000 mark per troy ounce at the end of the week, adding to Thursday’s advance. However, expectations for a hawkish Fed remain steady and keep the yellow metal’s potential upside contained.

Crypto Today: Bitcoin at $60,000, Ethereum at $1,500, and XRP at $1 face a make-or-break test

Bitcoin (BTC), Ethereum (ETH), and Ripple (XRP) are trading in the red on Friday after three consecutive days of losses, testing their respective make-or-break support levels.

Week ahead – NFP report to challenge Dollar strength and the hawkish Fed

Dollar strength dominates markets, as the hawkish Fed overshadows geopolitics and lower oil prices. NFP week could drive September Fed hike expectations and boost market volatility. The euro lacks fresh bullish catalysts, all eyes on the preliminary inflation report and the ECB Forum.

Regime change: Inside Kevin Warsh's first move to make the Fed unreadable on purpose

The rate did not move. That was the least interesting thing about Kevin Warsh's first meeting in charge of the Fed. The FOMC held its benchmark at 3.50%-3.75% for the fourth straight meeting, exactly as priced, and then the new chair used his first press conference to dismantle the machinery the market has leaned on for a decade.