|

V300AEQ ETF Units Elliott Wave technical forecast [Video]

ASX: V300AEQ ETF UNITS – VAS Elliott Elliott Wave Technical Analysis TradingLounge (1D Chart).

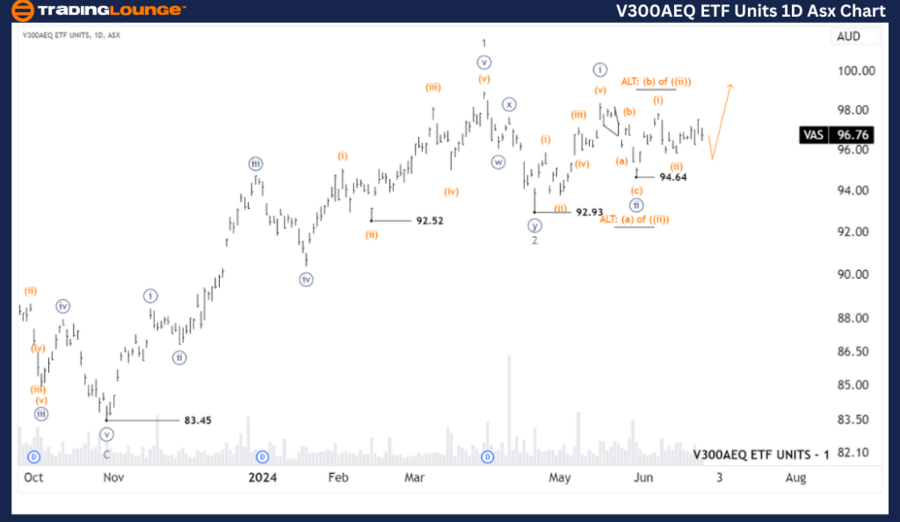
Greetings, Our Elliott Wave analysis today updates the Australian Stock Exchange (ASX) with V300AEQ ETF UNITS – VAS. We see that wave 2-grey has ended and wave 3-grey is unfolding to push higher, sub waves are developing in the form of wave ((i)),((ii))-navy and have ended, Wave ((iii))-navy may be unfolding to push higher.

ASX: VAS Elliott Wave technical analysis  

Function: Major trend (Minor degree, grey). 

Mode: Motive. 

Structure: Impulse. 

Position: Wave ((iii))-navy of Wave 3-grey. 

Details: The short-term outlook shows that wave ((ii))-navy has just ended and it seems that wave ((iii))-navy is opening to push higher, while price must always maintain above 94.64 to maintain this outlook. 

Invalidation point: 94.64.
VAS

ASX: VAS four-hour chart analysis

Function: Major trend (Minute degree, navy). 

Mode: Motive.

Structure: Impulse. 

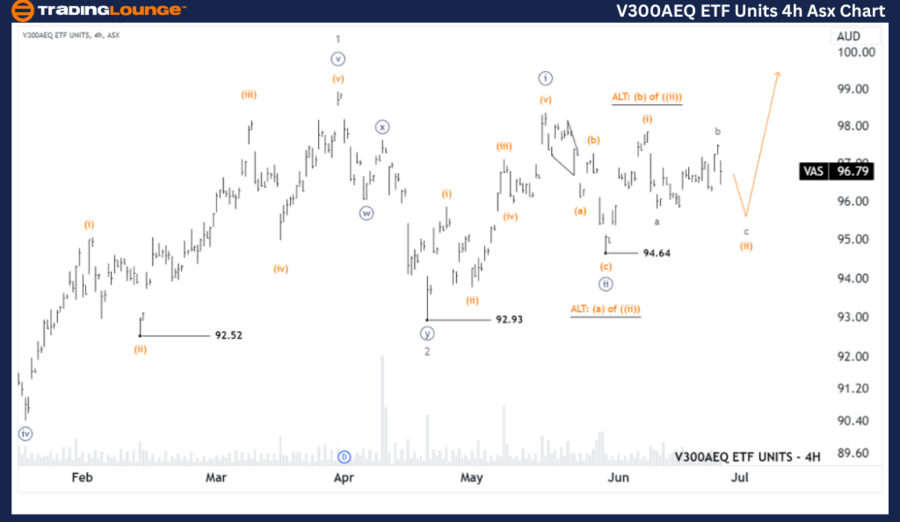
Position: Wave c-grey of Wave (ii)-orange of Wave ((iii))-navy. 

Details: The shorter term outlook shows that wave ((i))-navy has just ended at 94.64 and wave ((iii))-navy is unfolding, it is subdividing into wave (i)-orange and it's over, now it's time for wave (ii)-orange to open up to push a little lower, after which wave (iii)-orange can return to push higher. 

Invalidation point: 94.64.
VAS

Conclusion

Our analysis, forecast of contextual trends, and short-term outlook for ASX: V300AEQ ETF UNITS – VAS aim to provide readers with insights into the current market trends and how to capitalize on them effectively. We offer specific price points that act as validation or invalidation signals for our wave count, enhancing the confidence in our perspective. By combining these factors, we strive to offer readers the most objective and professional perspective on market trends. 

V300AEQ ETF Units Elliott Wave technical forecast [Video]

Author

Peter Mathers

Peter Mathers

TradingLounge

Peter Mathers started actively trading in 1982. He began his career at Hoei and Shoin, a Japanese futures trading company.


More from Peter Mathers
Share:

Editor's Picks

AUD/USD remains depressed near 0.6950 after RBA minutes

AUD/USD attracts follow-through selling during Tuesday’s Asian session, looking to extend the overnight rejection slide from 0.7000, or a two-week top, following the release of RBA meeting Minutes. The US Dollar retains a bullish undertone near its highest level since April 2025 as energy-driven inflation risks keep December Fed rate hike bets firmly on the table. Adding to this, geopolitical risks further underpin the safe-haven USD.

USD/JPY extends retreat below 158.50 as intervention risks loom

USD/JPY is dropping below 158.50 in the Asian session on Tuesday, snapping a two-day winning streak and pulling back from an over two-week top touched the previous day, despite Japan's soft PPI inflation print. Bulls turn cautious amid speculation that authorities will step in to prop up the Japanese Yen, which, in turn, weighs on the pair.

Gold advances to $4,200 amid retreating USD; Fed hike bets to cap further gains

Gold builds on its modest intraday move up and hits a fresh daily high around the $4,200 neighborhood during the Asian session. The US Dollar retreats from its highest level since April 2025 amid some profit-taking, offering support to the commodity. However, the US Federal Reserve's hawkish stance and escalating Middle East conflicts could limit deeper losses for the safe-haven buck.

Cardano: Retail support wanes as ADA tests a make-or-break level

Cardano price is up nearly 2% at press time on Tuesday, holding above its 50-day Exponential Moving Average (EMA) at $0.2302 and a near-term rising support trendline at $0.2264. ADA is losing retail demand in the derivatives market as its futures Open Interest declines and funding rates flip negative.

Indian Rupee gains further on RBI’s fresh measures to lower US Dollar’s demand

The Indian Rupee extends the Monday’s advance against the US Dollar on Tuesday, driven by the announcement of fresh Reserve Bank of India’s US Dollar-related measures to shore up the domestic currency. In the opening session, the USD/INR pair tumbles 0.6% to near 95.00, the lowest level seen in over a month.

Has Bitcoin really escaped the macro forces it was built to fight?
Over 17 years ago, Satoshi Nakamoto designed Bitcoin (BTC) on the back of a global financial crisis as an alternative to the global monetary system outside the control of central banks, governments and traditional intermediaries. This raises a key question: has Bitcoin really become independent of the macroeconomic forces it was built to challenge?